
Bulletin – May 2026 Payments Bank Fees in Australia

Abstract
This article updates RBA analysis of bank fees charged to Australian households, businesses and government. Over the year to June 2025, total fee revenue earned by banks increased by 3 per cent, though fee revenue remained stable as a share of banks’ assets and deposits. Fee revenue was supported by growth in new housing and business lending, the continued withdrawal of home loan cashback deals (which reduce fee revenue) and international transactions fee revenue associated with growth in overseas spending by Australian households. Large businesses continued to contribute most to banks’ fee revenue, followed by households and medium-sized businesses.
Introduction
This article updates previous RBA research on bank fees and covers the year to June 2025. Since 1997, the RBA has collected information on the fees charged to households and businesses by banks through their Australian operations. The 2024/25 data captured 43 lenders, which accounted for 88 per cent of total credit outstanding.
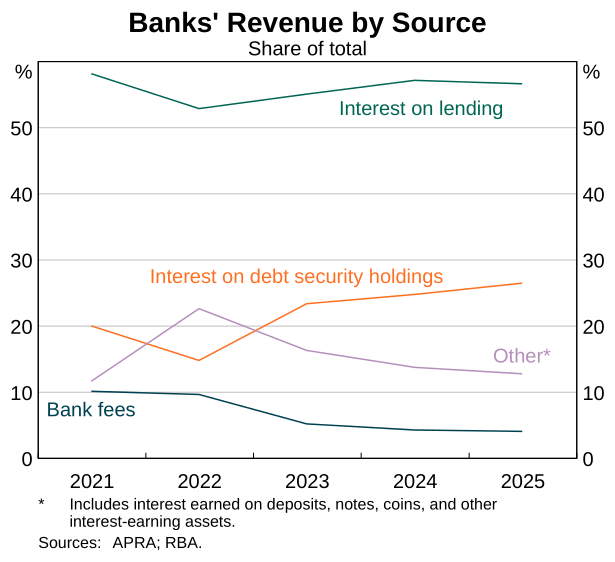
Banks charge fees to their customers for the services they provide to them, such as the provision of loans, deposit services and payment services. Although fees comprise a small share of banks’ revenue (Graph 1), monitoring bank fees over time is important in understanding the costs Australians incur for accessing and using banking services. These fees broadly fall into the following categories:
- Account servicing fees charged to cover account-keeping costs. These include regular servicing fees (such as annual and monthly credit card fees) and application, settlement and establishment fees for loans.
- Transaction fees charged on international transactions, ATM withdrawals from deposit accounts, and drawdowns and redraws for loans.
- Merchant fees charged for providing payment processing services. These include transaction, joining, and payments terminal rental fees.
- Other fees include break fees (charged when a customer prematurely terminates a contract, such as a fixed-term deposit or loan) and exception fees (charged when a customer breaches a contract, such as making a late payment on a loan or having insufficient funds in their deposit account).
Total fee revenue
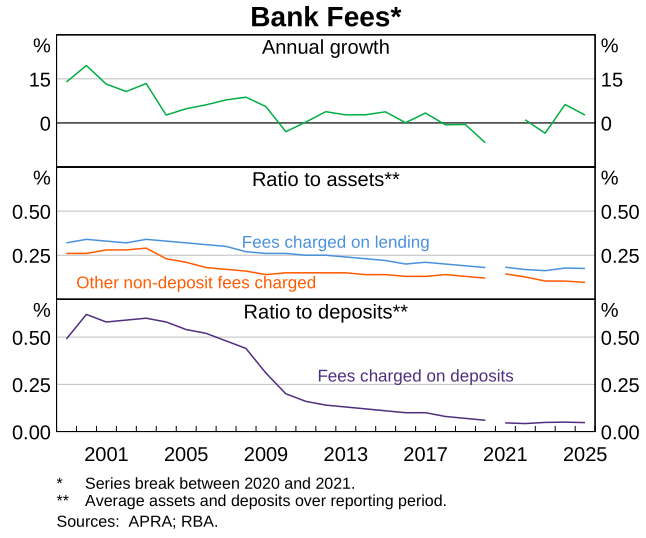
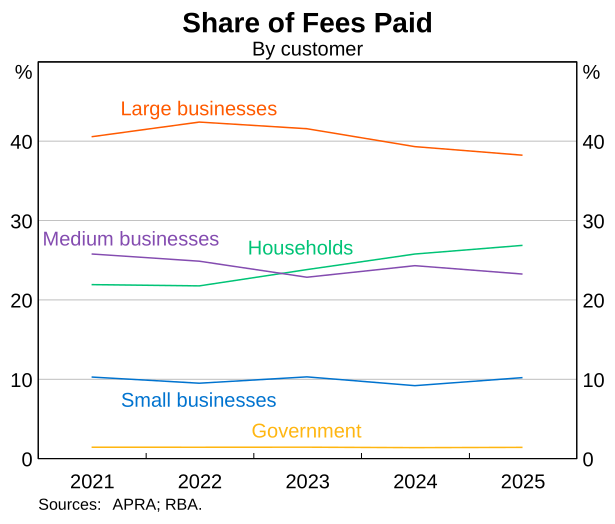
Banks’ total fee revenue increased by 3 per cent over the year to June 2025, though as a share of assets and deposits remained stable at a low level (Graph 2). The share of fee revenue paid by households has increased a little in recent years, while the share paid by large businesses has declined a touch (Graph 3). Even so, large businesses continued to pay the largest share of total bank fees. Households and medium-sized businesses each paid around 25 per cent of total fee revenue, and small businesses accounted for around 10 per cent. These trends are explored in more detail below.
Fees charged to households
Fee revenue from households grew by 7 per cent in the year to June 2025, reflecting strong growth in earnings from fees charged on housing loans and credit cards and modest growth in deposit fee revenue. This more than offset a decline in revenue from fees charged on personal loans (Graph 4).
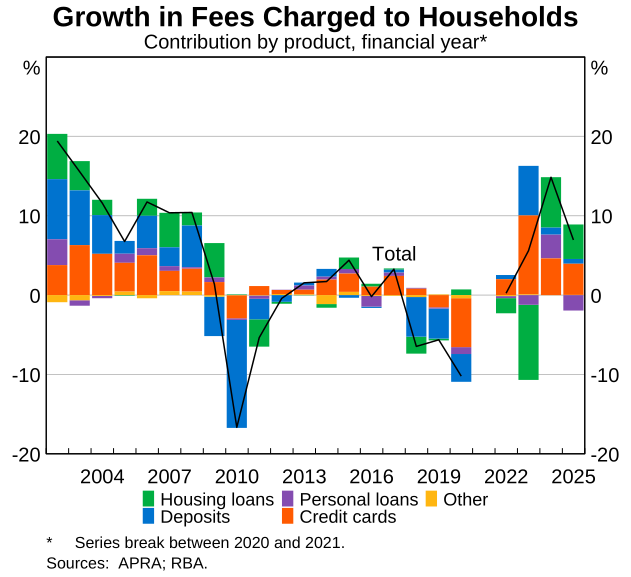
Fee revenue from housing loans increased by 17 per cent in the year. This largely reflected the continued withdrawal of cashback deals for new and refinancing mortgage borrowers (as cashbacks reduce income received from account servicing fees). Growth in new housing lending and refinancing also contributed to an increase in fee revenue for negotiating and establishing new loans, as well as break fees associated with discharging previous loans.
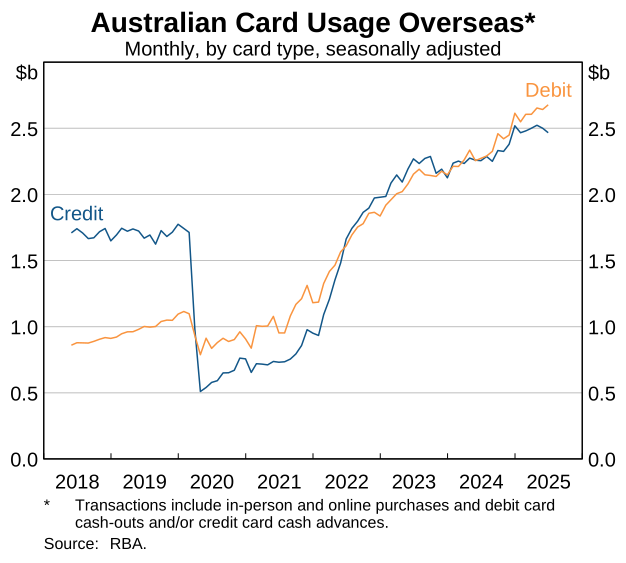
Fee revenue from credit cards increased by 10 per cent. This was largely driven by an increase in overseas spending and foreign currency conversion fees (Graph 5), alongside a similar increase in international travel (ABS 2025). Increases to annual and establishment fee revenue also contributed to the growth in credit card fee revenue. Credit cards remained the largest source of bank fees paid by households, comprising around 40 per cent of household bank fees in the year to June 2025.
Fee revenue from personal loans declined by 19 per cent over the year. This was largely because some lenders ceased offering new personal vehicle finance and sold their vehicle loan books to non-bank entities that are not required to report their fee income to APRA.
Fee revenue from household deposits increased by 3 per cent, partly reflecting a continued rise in households’ overseas debit card spending (which generates fees from foreign currency conversions and international transactions; Graph 5). However, growth in this source of fee revenue was partially offset by some lenders refunding fees to households in response to ASIC’s 2024 ‘Better Banking for Indigenous Consumers’ report (ASIC 2024), which found that some banks kept low-income customers on inappropriate high-fee accounts between November 2021 and November 2022.1 Further refund activity is expected to occur during 2025/26, including in response to ASIC’s 2025 ‘Better and Beyond’ report (ASIC 2025).
Fees charged to businesses and government
Fee revenue from institutional customers increased by 1 per cent in the year to June 2025, almost entirely driven by fee revenue earned on business loans (Graph 6).2 Fees charged on business loans remained the largest component of banks’ institutional fee revenue, comprising a little over half of earnings from fees charged to institutions, and a little over one-third of total fee revenue.
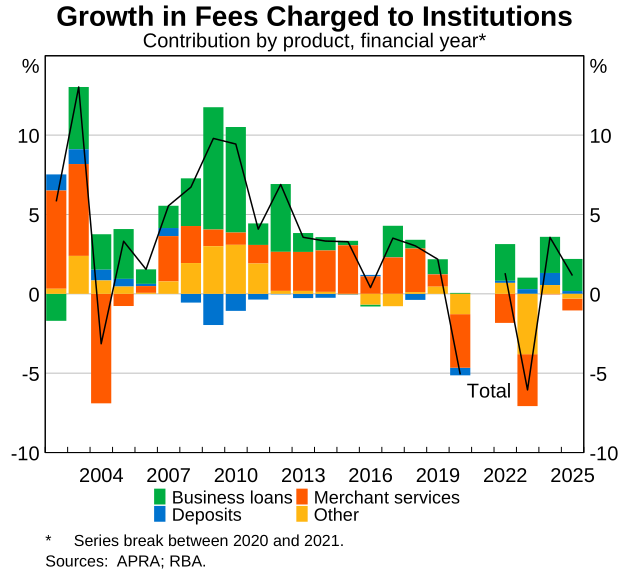
Fee revenue from business loans increased by 4 per cent over the year, supported by continued strength in business credit growth (RBA 2025a). As with households, the majority of banks’ institutional fee income continues to come from account servicing fees, which include application, settlement and establishment fees. Fees paid by large businesses accounted for 55 per cent of the growth, although fees paid by small- and medium-sized businesses also increased in the year. As a share of business credit outstanding, revenue from fees on business loans was broadly stable at 0.5 per cent.
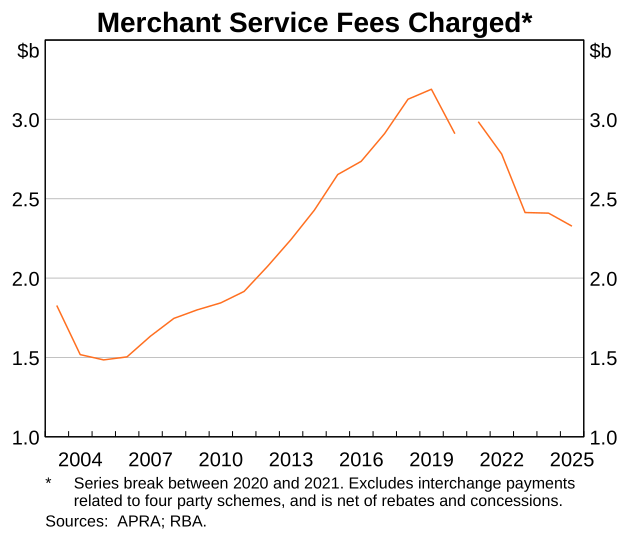
Banks’ earnings from merchant services fees declined a little over the year (Graph 7). Fee revenue earned from merchant services fees declined strongly between 2019 and 2023, partly reflecting several banks selling off their merchant service businesses to entities that are not required to report their fee income to APRA (Dunphy 2024; Gao 2025). Trends in merchant fees charged by all providers (including non-banks) are available in the RBA’s retail payments statistics (RBA 2025b). The RBA published a Conclusions Paper in March 2026 that sets out the final decisions of the Payments System Board on the Review of Merchant Card Payment Costs and Surcharging (RBA 2026a).
Fee revenue from business deposits increased by 3 per cent in the year, as an increase in account servicing fee revenue more than offset a decrease in transaction fee revenue. This partly reflected an increase in foreign currency deposits, which attract higher account servicing fees, and changes in fee pricing structure for some banks.
Other fees charged to institutions decreased by 1 per cent. Other fees include miscellaneous fees relating to activities such as deed transmissions and guarantees. Fee revenue from commercial bills continued to decline over 2024/25.
Conclusion
Fees charged by banks through their domestic operations represent a small share of banks’ total earnings, accounting for around 4 per cent of total revenue in 2024/25. Banks’ total fee revenue increased modestly for the second year in a row but remained stable as a share of banks’ assets and deposits. Fee revenue was supported by recent strength in new housing and business lending, as well as the continued withdrawal of home loan cashback deals and increased overseas spending by Australian households. By customer type, large businesses continued to contribute most to banks’ fee revenue, followed by households and medium-sized businesses.
Endnotes
* The authors are from Domestic Markets Department. The authors would like to thank Jess Young, Peter Wallis, Sam Buckland and Michael Reschke for their assistance. For underlying data on domestic banking fees charged, see RBA (2021) and RBA (2026b).
1 Refunds are reported in the year they are processed, rather than the year in which the fees were charged.
2 Institutional customers are defined as private and public sector businesses and general government. Fees charged to general government comprise a small share of fees charged to institutions.
References
ABS (Australian Bureau of Statistics) (2025), ‘Overseas Arrivals and Departures, Australia – 2024-25 Financial Year’, 14 August.
ASIC (Australian Securities and Investments Commission) (2024), ‘Better Banking for Indigenous Consumers’, Report No 785, July.
ASIC (2025), ‘Expanding Better Banking Outcomes to More Low-income Australians’, Report No 811, July.
Dunphy J (2024), ‘Bank Fees in Australia’, RBA Bulletin, January.
Gao R (2025), ‘Bank Fees in Australia’, RBA Bulletin, January.
RBA (Reserve Bank of Australia) (2021), ‘Statistical Table – Domestic Banking Fee Income – 1997 to 2020 – C9’.
RBA (2025a), ‘Section 1.4 Australian Banks and Credit Markets’, Statement on Monetary Policy, August.
RBA (2025b), ‘Retail Payments – June 2025’, 7 August.
RBA (2026a), ‘Merchant Card Payment Costs and Surcharging’, Conclusions Paper, March.
RBA (2026b), ‘Statistical Table – Domestic Banking Fees Charged – C9’.
Underlying data
This file contains all underlying data that are available for public release. Underlying data