Bulletin – July 2009 Trends in Relative Consumer Prices[1]
- Download 188KB
Introduction
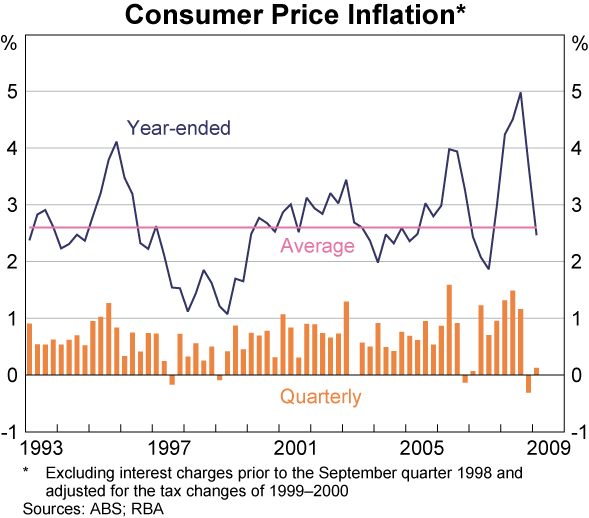
The principal medium-term objective for monetary policy is to control inflation, expressed as a target rate of consumer price inflation of between 2–3 per cent, on average, over the cycle. Since the adoption of inflation targeting in 1993, consumer price inflation in Australia has averaged close to 2½ per cent a year (Graph 1). This average, however, masks considerable variation in the pace of price growth of the various goods and services included in the Consumer Price Index (CPI), reflecting the varying underlying trends in productivity, input costs, margins and changes in government policy. This article documents and discusses these longer-run movements in relative prices, and the reasons behind them. In particular, it shows that over the past 16 years, the aggregate price of manufactured items has barely changed, while the price of services and food and beverage categories have tended to increase at an average annualised rate of around 3–4 per cent.
CPI Categories
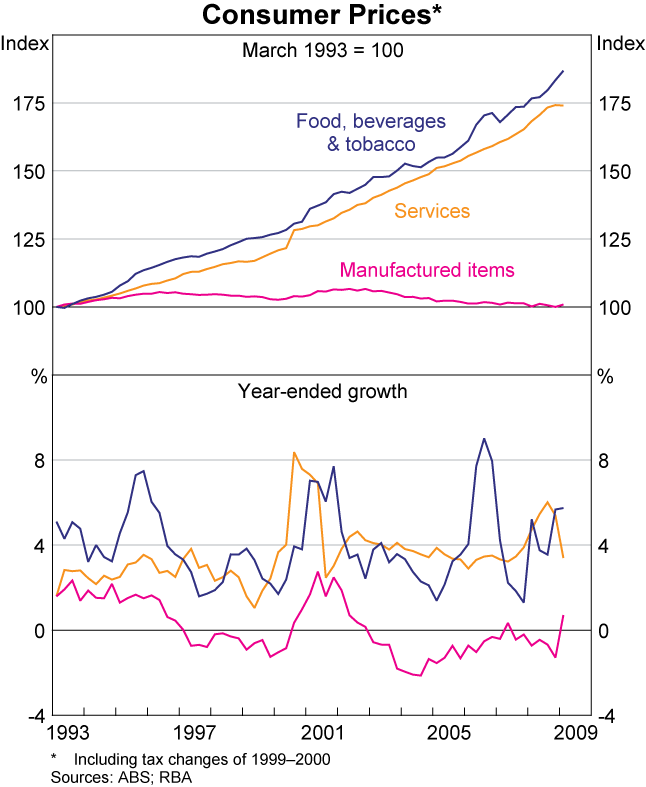
The CPI measures changes in retail prices of goods and services commonly purchased by metropolitan households. For the purposes of this article the various goods and services in the CPI have been divided into three main categories: manufactured items; food, beverages and tobacco; and services (automotive fuel is considered separately; Table 1 and Graph 2).[2] Although idiosyncratic features have played a role in price developments of individual goods and services, the very low rate of inflation in manufactured prices over the past decade and a half relative to the other categories is a theme that persists throughout.
| Current effective weight Per cent | Average increase since March 1993 | ||
|---|---|---|---|
| Annualised percentage change | |||
| Including GST | Excluding GST | ||
| CPI | – | 2.7 | 2.5 |
| – excluding interest charges | – | 2.8 | 2.6 |
| Category | |||
| Manufactured items | 19 | 0.1 | 0.1 |
| Food, beverages & tobacco | 19 | 4.0 | 3.9 |
| Services | 58 | 3.5 | 3.2 |
| Automotive fuel | 4 | 3.7 | 3.6 |
|
Sources: ABS; RBA |
|||
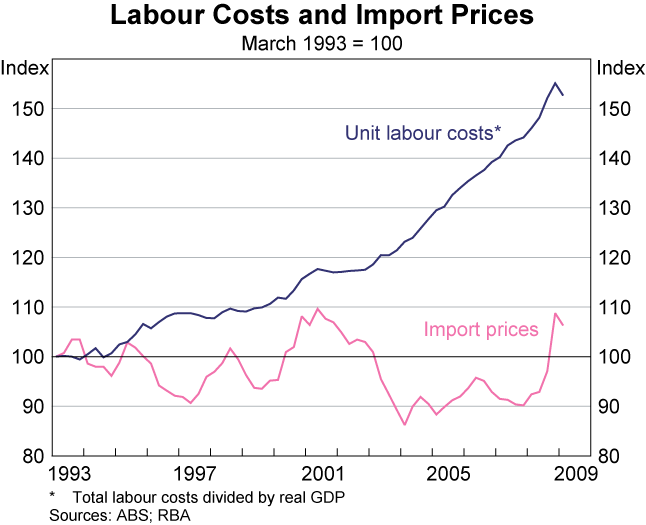
This divergent trend in inflation between categories reflects developments in key underlying drivers of inflation such as wages, productivity and import prices. For example, services prices typically have a high domestic labour cost component, whereas manufactured item prices are more dependent on developments in world prices. Developments in domestic wages and labour productivity can be summarised using a measure of total labour costs per unit of output produced (termed unit labour costs). This measure has increased at an average pace of 2.7 per cent a year over the inflation-targeting period, underpinning a firm pace of inflation in consumer items that have a relatively high domestic labour share (Graph 3).[3] In contrast, aggregate import prices have risen at a more modest 0.4 per cent a year.
Measurement Issues
Before examining price movements of the three main categories in more detail, it is important to note that the analysis of price indices presents a few measurement issues. First, each successive CPI series introduces new items while others are dropped. Hence, establishing a time series of item prices requires combining some series that may have compositional differences over time. Over the 16-year period starting in the March quarter 1993, the major changes include the introduction of house purchase costs in 1998 and financial services (including deposit and loan facilities) in 2005; both are included in the ‘services’ category in this analysis. However, mortgage interest and consumer credit charges, which were included in the CPI until June 1998, are excluded here.
Second, changes in government tax, rebate and subsidy policies affect the prices of different items by different magnitudes at different times. This was especially evident at the introduction of the GST in mid 2000, which replaced excise taxes charged on some items but not on others. Changes in subsidies have also affected child care prices, hospital costs and primary and tertiary education charges at different times. However, over the extended period examined here, the various tax and subsidy changes represent only a relatively small share of the total change in prices for most of the items included in the CPI. Hence, the data shown in the remainder of this article have not been adjusted for the tax and subsidy changes.
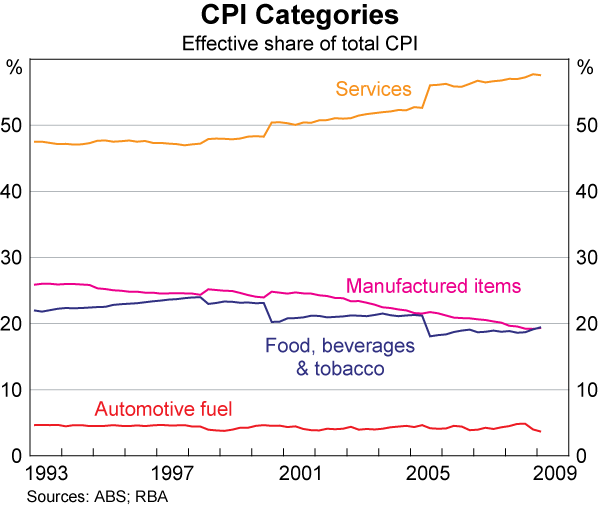
Third, the effective weight of each category changes over time in response to the varying pace of the price increases across categories, the reweighting of CPI items (roughly every five years) and the addition of new consumer items (Graph 4).[4] Since the early 1990s, the weight of services in the CPI has increased by around 10 percentage points. This is consistent with the trend increase in spending on services, reflecting the increase in their demand over time, and also the inclusion of new items in the CPI, such as financial services in 2005. This increase has come at the expense of the share of manufactured goods, which has fallen by 7 percentage points in the CPI, and the share of food, beverages and tobacco spending, which has fallen by 3 percentage points.
Manufactured Items
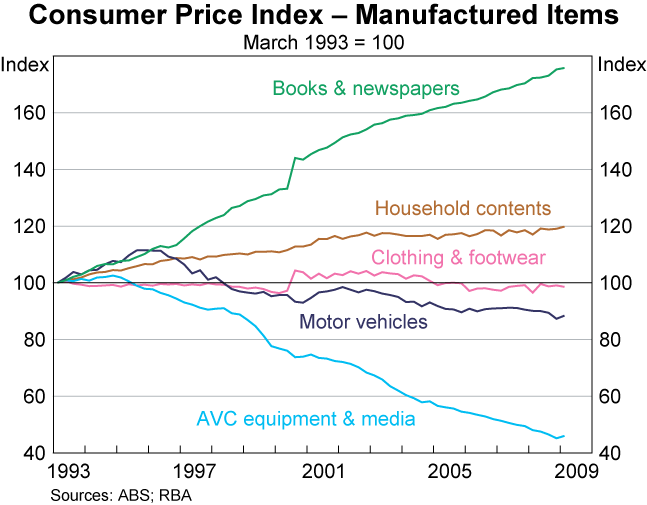
Manufactured items mainly comprise household contents, clothing and footwear, motor vehicles and recreational goods, and currently account for almost 20 per cent of the total CPI (Table 2 and Graph 5). On average, manufactured goods prices have been broadly unchanged since the early 1990s and prices of several items have actually fallen in nominal terms. This reflects several factors, including the shift to large-scale, low-cost production of many of these items in the developing world. The price index for the clothing and footwear sub-category, for example, has remained broadly unchanged over the past decade and a half, with outerwear and footwear prices falling over the period. Advances in technology have been an important driver of lower prices for some manufactured items such as audio, visual and computing (AVC) equipment and media with the price index for these items having fallen by 54 per cent since March 1993. Similarly, the price index for motor vehicles has fallen by 12 per cent over this period. These falls do not represent the change in actual amounts spent on these items; rather, they represent estimates of the pure price change, after the ABS adjusts observed price changes for the significant improvement in product quality. Tariff reductions for clothing and footwear and motor vehicle imports have played a role in keeping their retail price low. Fluctuations in the exchange rate have a noticeable effect on manufactured goods prices in the short run, though overall exchange rate movements have played a limited role in price trends over the past decade and a half.[5]
| Current effective weight Per cent | Average increase since March 1993 Annualised percentage change | |
|---|---|---|
| Manufactured items | 19 | 0.1 |
| Selected sub-categories | ||
| Books & newspapers | 1 | 3.6 |
| Household contents | 7 | 1.1 |
| Clothing & footwear | 3 | −0.1 |
| Motor vehicles | 4 | −0.8 |
| AVC equipment & media | 2 | −4.7 |
|
Sources: ABS; RBA |
||
Food, Beverages and Tobacco
Food, beverages and tobacco prices also currently comprise about 20 per cent of the total CPI and collectively have increased by an average annualised rate of 4 per cent over the past decade and a half (Table 3 and Graph 6). The various types of food included in the CPI show a broadly similar trend price increase over this period, although the prices for dairy, cereals and fruit and vegetable items have grown comparatively fast in recent years. The recent strong price rises for these goods partly reflects the increase in raw food input prices – which have been affected by the poor conditions for agriculture in Australia and the rise in prices globally – though the raw input is only one part of the final retail price due to processing and distribution costs, and margins.
| Current effective weight Per cent | Average increase since March 1993 Annualised percentage change | |
|---|---|---|
| Food, beverages & tobacco | 19 | 4.0 |
| Selected sub-categories | ||
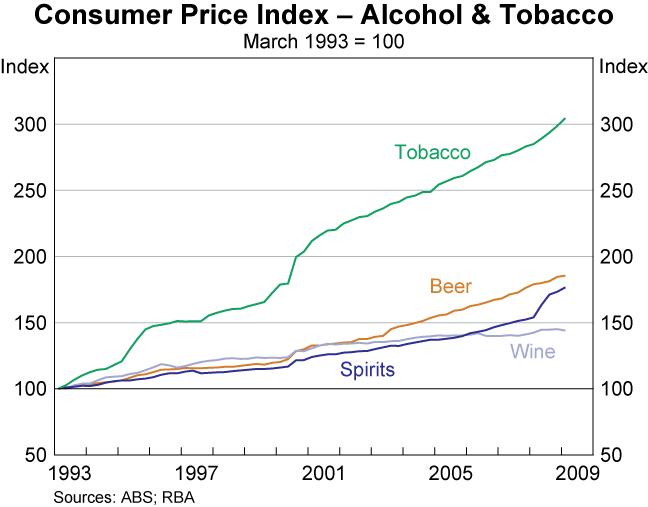
| Tobacco | 3 | 7.2 |
| Fruit & vegetables | 3 | 4.1 |
| Dairy | 1 | 4.0 |
| Bread & cereals | 2 | 3.8 |
| Alcohol | 4 | 3.3 |
| – Beer | 2 | 3.9 |
| – Spirits | 1 | 3.6 |
| – Wine | 1 | 2.3 |
| Drinks & snacks | 2 | 3.3 |
| Meat & seafood | 2 | 3.2 |
|
Sources: ABS; RBA |
||
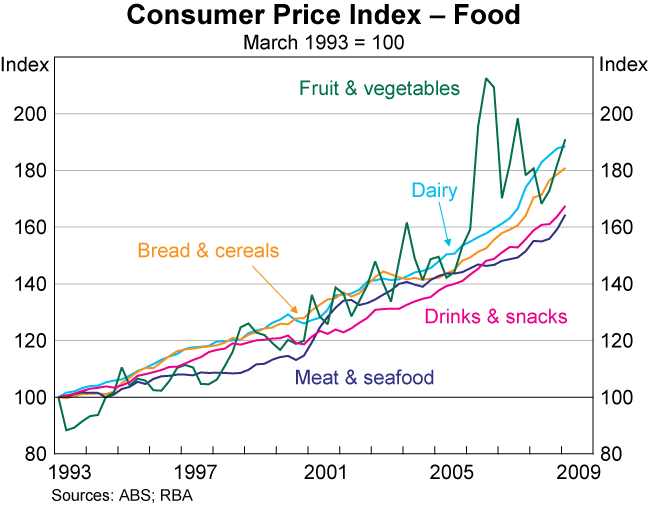
Tobacco prices rose very strongly in 1995 and again in 1999 due to additional increases in excises imposed in these years. These increases, combined with the effects of GST, have meant that tobacco prices have recorded the strongest increase of any item in the CPI over the inflation-targeting period (Graph 7). Wine prices have increased at a slower pace than other types of alcohol, in part due to the strong growth in the production of wine in recent years.
Services
The services category accounts for close to 60 per cent of the CPI and includes education, health, housing, communication, child care, travel, insurance costs and takeaway and restaurant meals (Table 4 and Graph 8). While sector-specific features have played a role in the price increases of some services sub-categories, the solid pace of services price increases generally reflects the comparatively high share of wages in their production costs, which have increased at a firm pace over time, coupled with the relatively weak pace of productivity growth in the sectors that produce many of these items.
| Current effective weight Per cent | Average increase since March 1993 Annualised percentage change | |
|---|---|---|
| Services | 58 | 3.5 |
| Selected sub-categories | ||
| Insurance services | 2 | 6.5 |
| Education | 3 | 5.2 |
| Health services | 4 | 4.5 |
| Housing | 21 | 3.5 |
| – House purchase costs(a) | 8 | 4.8 |
| – Utilities | 4 | 3.5 |
| – Rents | 6 | 3.2 |
| – House repairs | 2 | 2.9 |
| Takeaway & restaurant meals | 5 | 3.4 |
| Motor vehicle repairs & charges | 3 | 2.9 |
| Holiday travel | 4 | 2.8 |
| Financial services(b) | 7 | 1.5 |
| Communication | 3 | 0.3 |
|
(a) Since June 1998 Sources: ABS; RBA |
||
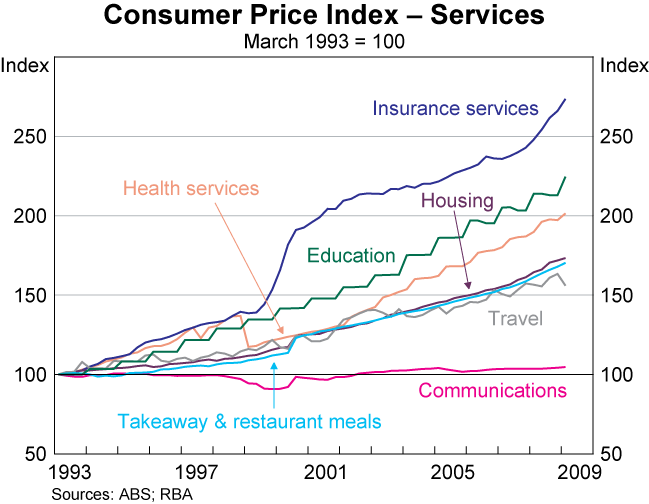
Housing-related costs, including the cost of purchasing a new home (excluding land), rents and utility charges, form a significant part of the services category. Since its introduction to the CPI in 1998, house purchase costs have grown strongly, reflecting the strength in the housing market over much of this period and the large increase in commodity input prices in recent years.[6] The prices of the other components of the housing sub-category have grown broadly in line with those of all services over the inflation-targeting period; although rents and utility charges have increased rapidly in the past five years or so, this followed a period of more modest growth in their prices during the mid 1990s.
The relatively rapid pace of growth of overall education prices reflects the labour-intensive nature of this service. Since detailed component data were introduced in June 2000, the price indices for primary and secondary education have increased especially strongly, reflecting increased demand for this service over time. Tertiary education costs have grown at a more moderate pace over this period, as prices faced by households have been contained by the Government's HECS fee-assistance program.
The price of health care purchased by households has also grown at a comparatively firm pace, partly reflecting the greater use of technology in patient care with labour cost increases also playing a role. The fastest-growing component of health care costs has been dental services. Hospital and medical service prices – around three-quarters of the weight of this sub-category – have increased almost as strongly, despite the introduction of a 30 per cent government rebate on private health insurance premiums in 1999 which provided a one-off reduction in the price level faced by households.
Communication charges have been the slowest-growing component in the services category over the past decade and a half. Prices have been broadly flat, reflecting strong productivity gains in the sector coupled with the considerable degree of competition.
The pace of the price increases in the other services items has been mixed. While the cost of insurance has been amongst the fastest-growing items in the CPI on average, in part, this reflects the imposition of the GST in 2000, the effect of which was magnified by the way insurance prices are measured in the CPI;[7] abstracting from this, insurance inflation has been around 4½ per cent a year. In contrast, child care cost increases have been relatively subdued, although this reflects the downward adjustment made to child care prices by the ABS due to changes in the way the government subsidy is treated from mid 2007, as well as subsequent increases in this rebate.
Conclusion
The pace of price increases for the items and main categories included in the CPI has varied over time. Price increases of manufactured items have remained very low over the past decade and a half, having benefited from globalisation, lower tariffs, improvements in technology and increased product market competition. Consistent with developments in other developed countries, the prices of services and food have increased at a faster rate, due to productivity differences between different sectors of the economy. Overall, the annualised rate of consumer price inflation has averaged around 2½ per cent since the early 1990s, which is around the middle of the target for monetary policy.
Footnotes
This article was prepared by David Orsmond and Tom Rosewall of Economic Analysis Department. [1]
These categories broadly retain the same structure as the 11 CPI ‘groups’ defined by the Australian Bureau of Statistics (ABS), although some of the components have been rearranged in order to better collate items that have similar characteristics. For example, the ABS group ‘household contents and services’ has been split between the categories ‘manufactured items’ and ‘services’ used in this article. The term ‘sub-category’ used in this article is also generally consistent with the CPI ‘subgroups’ defined by the ABS. [2]
Nominal unit labour costs are estimated using total labour costs divided by real GDP (both series are sourced from the ABS National Accounts, Cat No 5206.0). In contrast, the ABS-published measure of unit labour costs – which has increased at an average pace of 2.3 per cent over the inflation-targeting period – uses a combination of wage rate, hours worked and real GDP data. [3]
Mortgage and consumer credit charges are included in the services category in this graph. Excluding interest charges, the share of services in the CPI has increased by around 15 percentage points since March 1993, while the share of manufactured items has fallen by 9 percentage points. [4]
The import-weighted exchange rate in the March quarter 2009 was broadly in line with the level recorded in the March quarter 1993. [5]
RBA estimates suggest that the ‘house purchase costs’ component would have increased at an average pace of 3¾ per cent a year if it was included in the CPI from 1993 (partly based on project home price data from the ABS House Price Indexes release, Cat No 6416.0). [6]
The price of insurance services in the CPI is defined as gross premium paid (including tax) less claims. A 10 per cent increase in insurance premiums will result in an increase in net premiums of more than 10 per cent assuming the before-tax premium and the value of claims are unchanged. [7]