Bulletin – May 2008 Regional Economic Performance[1]
- Download 122KB
Introduction
The current economic expansion has been broadly-based across the states, with unemployment around multi-decade lows in all states and territories. While growth rates in Western Australia and Queensland have been the highest in the country in recent years, the divergences between the states narrowed somewhat over 2007, with high growth rates being recorded in most states. In aggregate, growth looks to have moderated in early 2008, and the slowdown has been broadly-based across states.
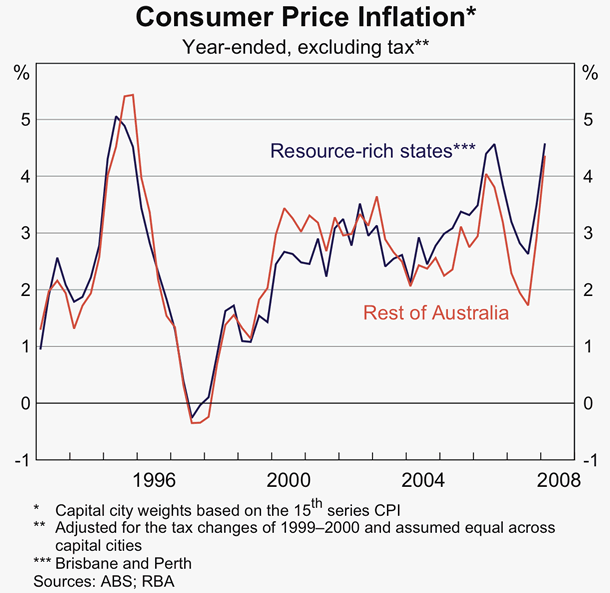
Historically, CPI inflation has typically varied little between the states. While inflation has generally been higher in the resource-rich states over the past few years, over the year to the March quarter 2008 it was well above 3 per cent in all capital cities.
Details of Recent State Economic Performance
There are a number of different indicators of overall economic activity at the state level. Conceptually, the preferred and most comprehensive measure of state output is gross state product (GSP). However, in practice the ABS does not regularly measure the interstate trade component of GSP. In addition, GSP is only published annually and with a significant lag; the latest data currently available are for 2006/07, reducing their usefulness as a measure of recent developments in the state economies.
Given the limitations of GSP estimates, this article focuses on state final demand to analyse recent state economic performance. While there are benefits to using this measure, the most obvious of which is timeliness, it also has statistical limitations. The most significant is that final demand measures growth in spending rather than output. This is problematic since in the states where spending is growing fastest it is likely that some of that demand is being met by output produced in other states.
Given the limitations with both GSP and state final demand data, we also look at other broad indicators of state economic performance, such as employment data and business surveys, when assessing the health of the state economies.
State Final Demand
Spending growth in the resource-rich states has been faster than in the rest of the nation for about the past five years (Graph 1). This can partly be explained by the higher long-run population growth of those states, but mostly reflects the stimulus from the run-up in commodity prices over this period and the associated reallocation of resources.
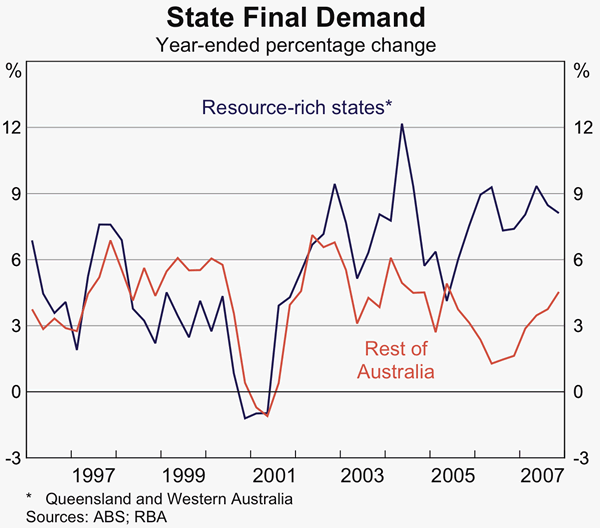
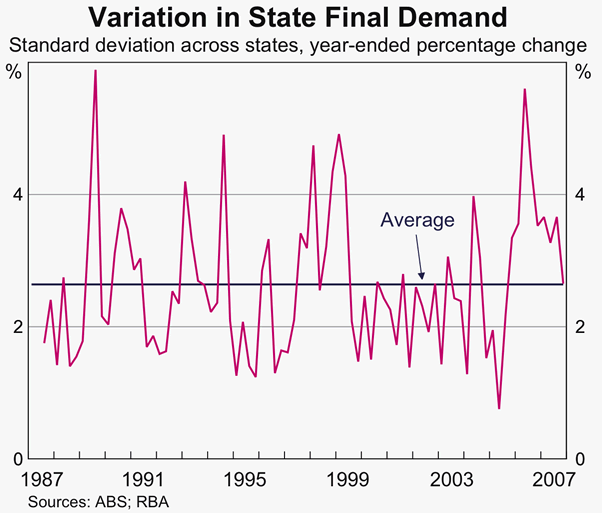
Domestic demand grew rapidly in 2007, with growth remaining strongest in Western Australia and Queensland. However, the gap with the other states narrowed somewhat, with growth rates in final demand above their long-run averages in most of the non-resource states as well (Table 1). Overall, the divergence in year-ended growth in state final demand across the states returned to around its historical average in 2007 (Graph 2).[2]
| 2007 | 1991–2007 | |
|---|---|---|
| NSW | 4.5 | 3.4 |
| Victoria | 5.2 | 4.3 |
| Queensland | 7.2 | 5.4 |
| South Australia | 2.7 | 3.3 |
| Western Australia | 9.7 | 5.4 |
| Tasmania | 7.7 | 3.4 |
|
Source: ABS |
||
Household Sector
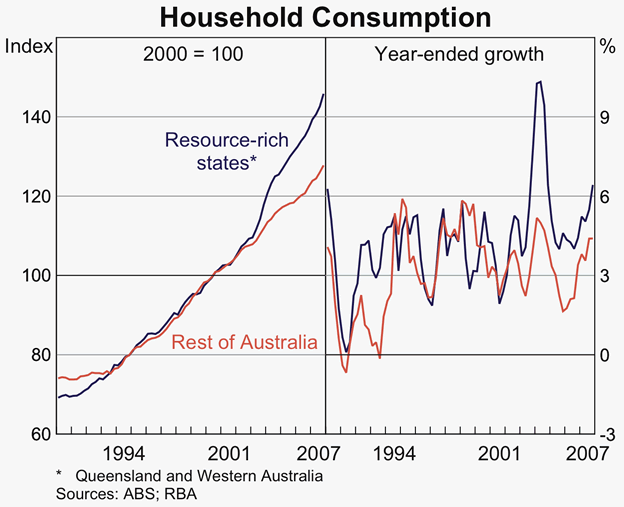
Household consumption growth increased in all states and territories over 2007, supported by broad-based strength in employment and average wages growth. In the non‑resource states, consumption growth picked up from less than 2 per cent in mid 2006 to an average of 4½ per cent over the year to the December quarter, while in the resource states consumption grew by more than 6 per cent (Graph 3).
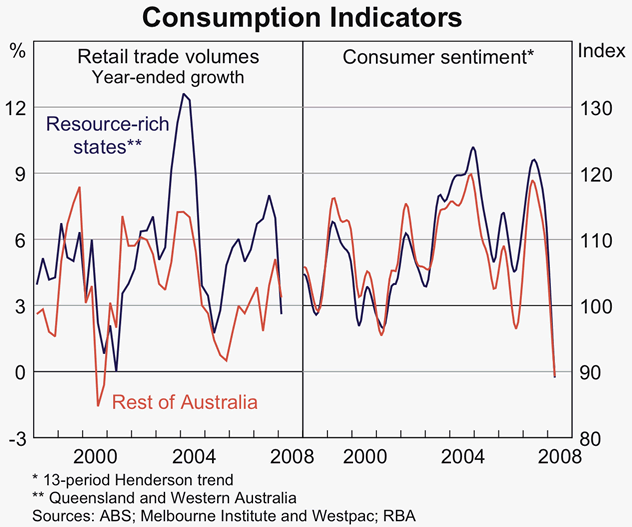
However, the pace of real retail spending growth moderated in the first quarter of 2008 (Graph 4). The slowing in growth was particularly marked in Western Australia, which may reflect the significant cooling in the Perth housing market over the past 18 months. Indeed, after a period of more rapid growth than in the rest of the country, real retail spending growth in the mining states was around the same as the average of the other states over the year to the March quarter. There has also been a significant fall in consumer sentiment in all states over recent months.
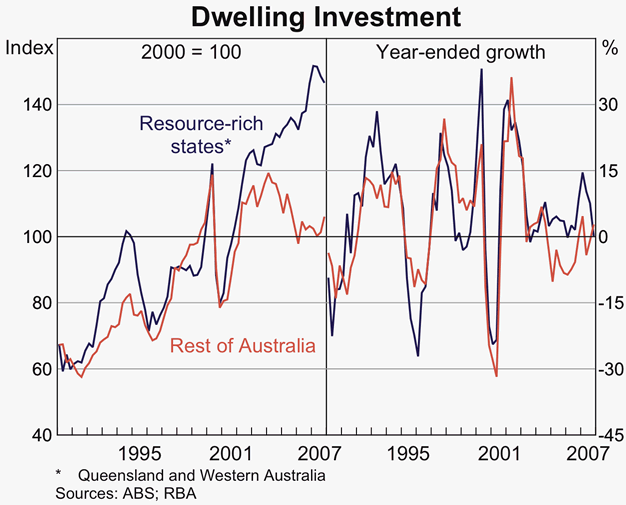
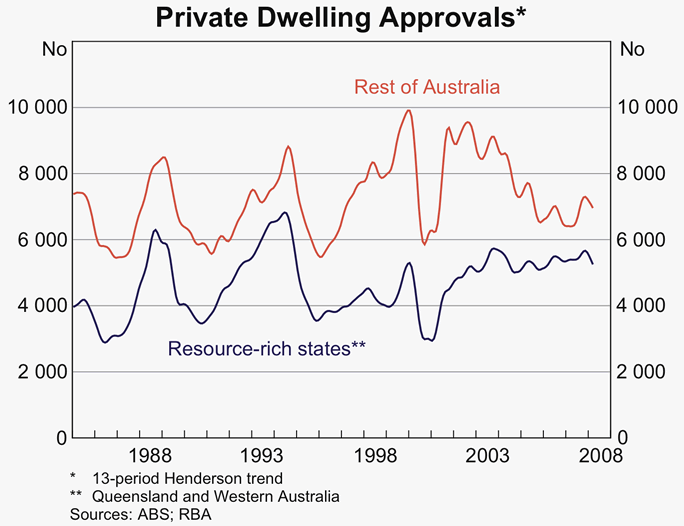
After a period of significant divergence, growth in housing investment converged somewhat over 2007, as growth in Queensland slowed, growth in Victoria picked up and conditions in NSW stabilised (Graph 5). More recent indicators of the housing market, such as new home sales and building approvals, suggest a broad-based moderation in early 2008, as the impact of tighter financial conditions is felt across all states (Graph 6).
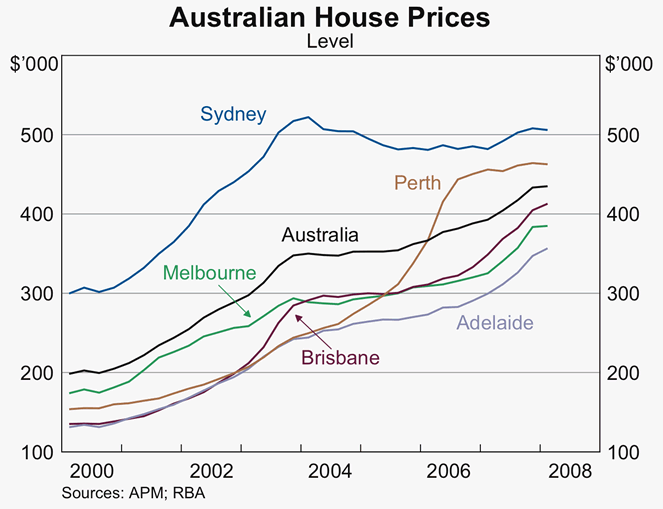
There have been significant divergences in house price growth across the major capitals (Graph 7). The end of the boom in 2003 resulted in a significant slowing in price growth in most capitals. Sydney was most affected, with average prices falling by around 10 per cent between late 2003 and early 2006, before resuming modest growth in 2007. Perth prices were least affected and subsequently reaccelerated, with overall growth of around 100 per cent between mid 2003 and late 2006. Since then, prices in Perth have been broadly flat. Price growth in Melbourne, Adelaide and Brisbane was relatively subdued between late 2003 and late 2006, before picking up strongly to around 20 per cent over 2007.
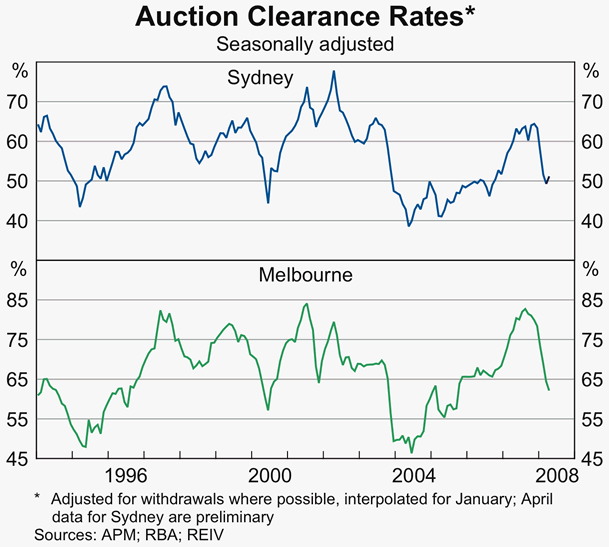
Over recent months, house price growth has slowed and auction clearance rates have moderated across the states, in the face of tighter financial conditions (Graph 8).
Business Sector
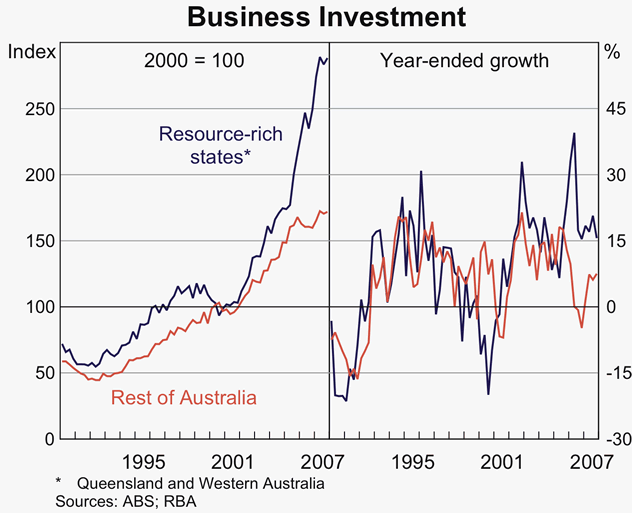
Divergences between the states have been perhaps largest in business investment spending, in large part due to the extraordinary growth in mining-related investment spending in Western Australia and Queensland. Nevertheless, business investment growth was relatively strong across all the states over 2007, with the gap between growth in the resource-rich states and the remainder of Australia narrowing as investment in NSW and Victoria recovered and growth moderated somewhat in Queensland (Graph 9). The Bank's liaison reports that growth in business investment remains strong into 2008, particularly for mining and infrastructure-construction-related projects. Non‑residential building construction activity also remains firm, although there are some signs of moderation, as uncertainty over the macroeconomic outlook and tighter financing conditions have begun to adversely affect firms' investment plans.
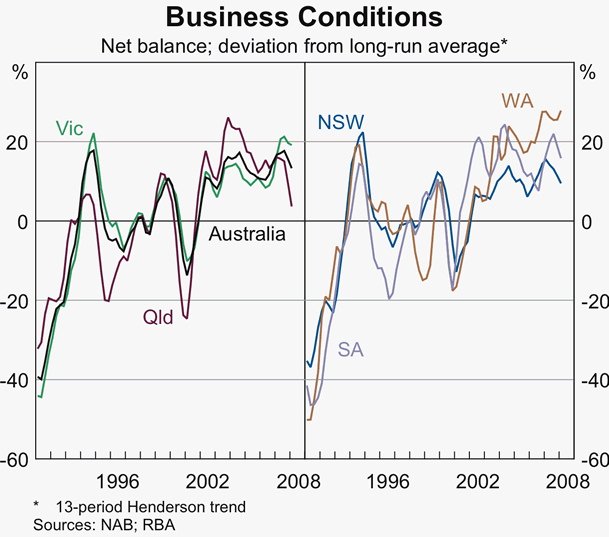
Business surveys provide further evidence that the strength of the economy over recent years has been broadly-based among the states, with business conditions well above average in all states in 2007. However, there appears to have been a moderation in most states over the first few months of 2008 (Graph 10).
Labour Market
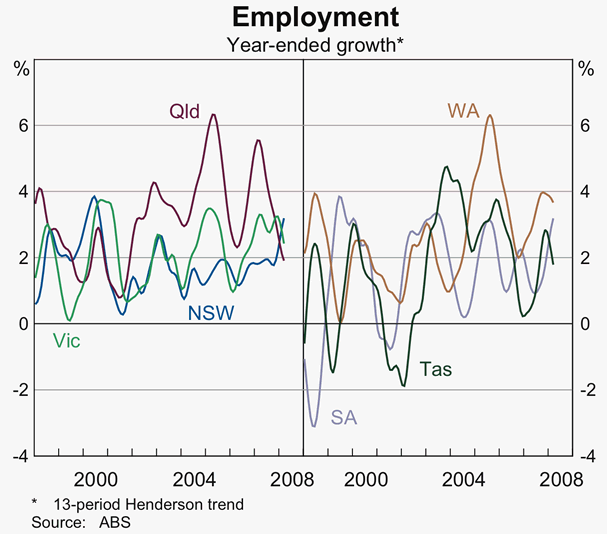
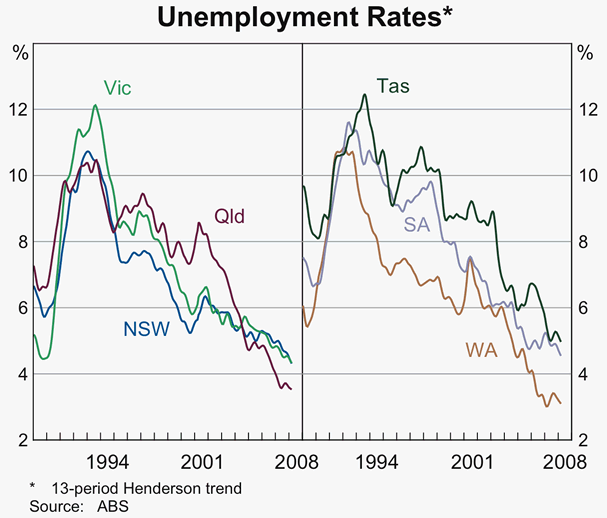
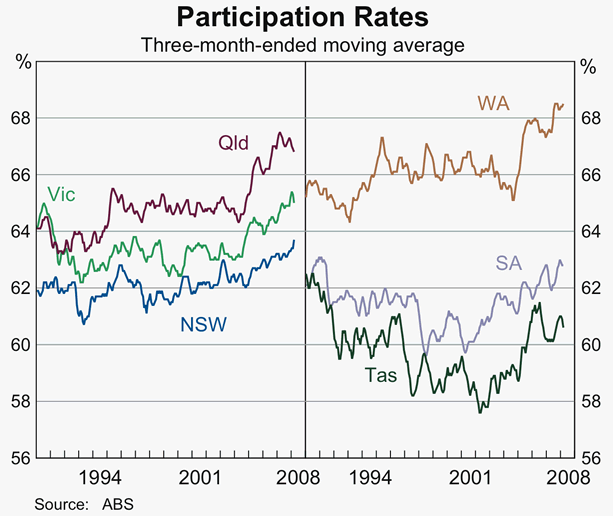
The broad strength in the economy is also evident in the state of the labour market, with above-average employment growth experienced in all the states over recent years (Graph 11). Strong labour demand has seen the unemployment rate fall to around 30-year lows in all states (Graph 12). While unemployment remains lowest in the resource-rich states, the unemployment rate has also fallen to very low levels in NSW and Victoria. Continued strong labour demand has also contributed to increases in labour force participation rates (Graph 13). While the participation rate in the resource-rich states has increased the most over the past few years, it has also risen in all other states.
Government Spending and Exports
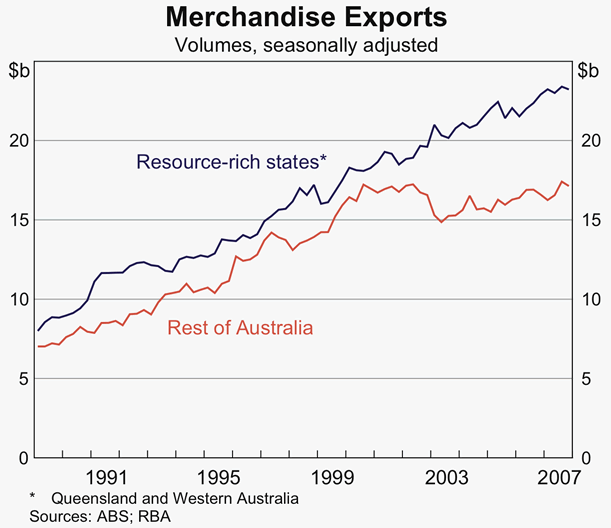
Growth in government spending has been significantly stronger in the resource-rich states over recent years, reflecting both increased demand for infrastructure and strong revenue growth in these states. Growth in international merchandise exports has been relatively soft over the past year in most states. The exception is in Western Australia, where exports have been boosted by significant expansions in capacity, particularly that related to iron ore, LNG and petroleum (Graph 14).
Migration Patterns
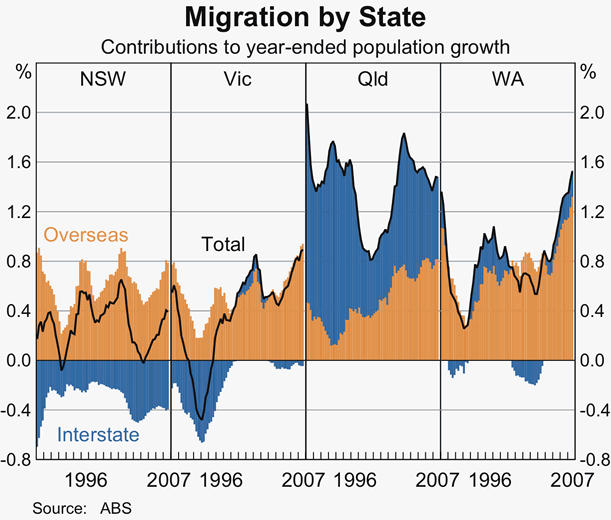
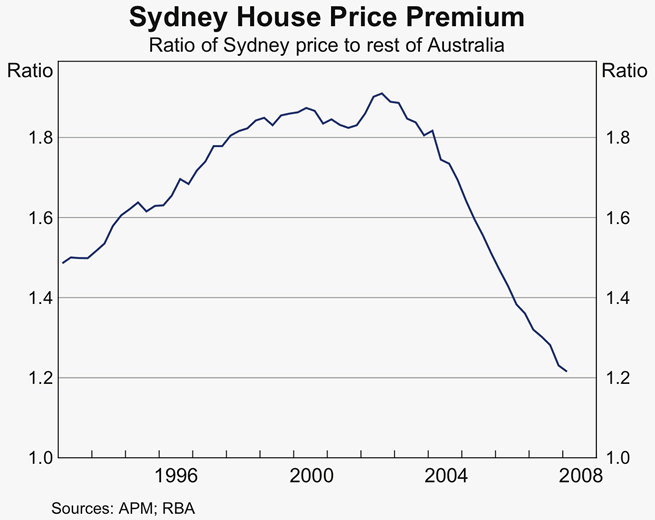
The strong economic performance of the resource-rich states over recent years has been accompanied by a significant change in Australia's migration patterns (Graph 15). Strong labour demand has seen net inward migration to Western Australia increase significantly, primarily due to a significant increase in net inflows from overseas. While there has also been a return to positive net interstate migration, after the outflows seen in the first few years of this decade, the flow remains relatively small, possibly due to Western Australia's geographical isolation. Queensland has also seen strong inward migration, with both interstate and overseas migration significant, although net interstate inflows have slowed a little over recent years, possibly reflecting a deterioration in housing affordability relative to New South Wales and Victoria. Net inward migration to Victoria has also been significant over recent years, reflecting both a reduction in the net loss of residents to other states and continued strong net inward overseas migration flows. Net migration into New South Wales has been smaller, with continued robust inward international migration in large part offset by significant outward interstate migration. However, the rate of outward interstate migration has slowed somewhat relative to that seen in 2005. This may, in part, reflect the significant reduction in the premium between house prices in Sydney and those in the other capital cities (Graph 16).
Inflation
Historically there has been little variation in inflation rates across the capital cities (Table 2, Graph 17). Not surprisingly, over recent years inflation has been highest in the resource-rich states. However, over the year to the March quarter 2008 there was only a small gap between the resource-rich and other states, with all capital cities experiencing inflation well above 3 per cent.
| Sydney | 2.5 |
|---|---|
| Melbourne | 2.4 |
| Brisbane | 2.6 |
| Adelaide | 2.5 |
| Perth | 2.7 |
| Hobart | 2.4 |
| Darwin | 2.3 |
| Canberra | 2.4 |
| All capital cities | 2.5 |
|
(a) Adjusted for the tax changes of 1999–2000 and assumed equal across capital cities Sources: ABS; RBA |
|
Appendix A: Size and Characteristics of the States
As shown in Table A1, NSW accounts for almost one-third of national output, population and employment, while Victoria accounts for around one-quarter of these variables. Consequently, economic conditions in the two largest state economies generally have a significant influence on national averages. However, average annual rates of growth in real output have been much higher in Queensland and WA over the past three decades, so that the relative size of these states has increased significantly (Table A2).
| NSW | Vic | QLD | WA | SA | Tas | |
|---|---|---|---|---|---|---|
| Output share | 32.2 | 24.3 | 18.8 | 12.8 | 6.6 | 1.9 |
| Population share | 32.8 | 24.8 | 19.9 | 10.0 | 7.5 | 2.3 |
| Employment share | 32.1 | 24.7 | 20.4 | 10.6 | 7.2 | 2.2 |
| Exports share(a) | 24.2 | 15.7 | 21.8 | 29.1 | 4.9 | 1.7 |
|
(a) Includes goods and services exports Source: ABS |
||||||
| NSW | Vic | QLD | WA | SA | Tas | Aus | |
|---|---|---|---|---|---|---|---|
| Since 1970/71 | 2.9 | 2.9 | 4.7 | 4.5 | 3.1 | 2.3 | 3.2 |
| During current expansion | 3.2 | 3.5 | 4.8 | 4.7 | 2.8 | 2.7 | 3.7 |
| 1991/92–2002/03 | 3.7 | 3.7 | 4.8 | 4.4 | 3.1 | 2.5 | 3.9 |
| 2002/03–2006/07 | 1.9 | 3 | 4.9 | 5.4 | 2.2 | 3.2 | 3.3 |
| 2006/07 | 1.8 | 2.7 | 4.9 | 6.3 | 0.8 | 2.1 | 3.2 |
|
Sources: ABS; Harris CP and D Harris (1992), ‘Interstate Differences in Economic Growth Rates in Australia, 1953–54 to 1990–91’, Economic Analysis and Policy, 22(2), pp 129–148 |
|||||||
In addition to substantial variation in their size and growth rates, states vary in their industry structure. As shown in Table A3, the larger states of NSW and Victoria have a disproportionate share of business services activity, reflecting the positions of Sydney and Melbourne as large business and financial centres. Victoria is also characterised by a high share of manufacturing. Primary industries remain important to Queensland, while WA remains distinguished by its large resource sector. In South Australia and Tasmania, agriculture and manufacturing account for higher shares of output than nationally, with the public sector also accounting for a relatively large share of output in Tasmania.
| NSW | Vic | QLD | WA | SA | Tas | Aus | |
|---|---|---|---|---|---|---|---|
| Agriculture | 1.3 | 2.3 | 2.8 | 2.1 | 3.4 | 5.4 | 2.1 |
| Goods production | 20.3 | 23.0 | 27.6 | 45.5 | 26 | 26.3 | 26.1 |
| Mining | 2.3 | 2.0 | 7.9 | 28.6 | 3.9 | 2.7 | 7.0 |
| Manufacturing | 10.0 | 12.5 | 9.3 | 7.3 | 13.2 | 13.8 | 10.2 |
| Utilities | 1.9 | 2.4 | 1.9 | 2.4 | 2.8 | 4.6 | 2.2 |
| Construction | 6.2 | 6.1 | 8.5 | 7.3 | 6.2 | 5.3 | 6.7 |
| Goods distribution | 14.6 | 15.5 | 17.2 | 13.3 | 14.2 | 15.0 | 14.9 |
| Wholesale trade | 4.9 | 5.5 | 4.6 | 3.5 | 4.0 | 3.5 | 4.6 |
| Retail trade | 5.5 | 5.5 | 7.0 | 4.7 | 5.9 | 6.7 | 5.7 |
| Transport & storage | 4.2 | 4.5 | 5.6 | 5.1 | 4.3 | 4.8 | 4.6 |
| Business services | 27.1 | 24.3 | 16.8 | 14.4 | 17.9 | 13.7 | 21.6 |
| Communications | 2.6 | 3.2 | 2.3 | 1.9 | 2.3 | 2.2 | 2.5 |
| Finance & insurance | 10.2 | 8.0 | 5.2 | 3.5 | 6.2 | 5.7 | 7.3 |
| Property & business services | 14.3 | 13.1 | 9.3 | 9.1 | 9.4 | 5.8 | 11.8 |
| Household services | 15.5 | 15.5 | 16.0 | 11.4 | 17.9 | 19.9 | 15.4 |
| Accommodation, cafes & restaurants | 2.3 | 1.6 | 2.7 | 1.2 | 2.2 | 2.4 | 2.1 |
| Education | 4.1 | 4.6 | 4.3 | 2.8 | 4.8 | 5.1 | 4.2 |
| Health | 5.7 | 6.0 | 5.7 | 4.7 | 7.2 | 8.6 | 5.8 |
| Cultural & recreational services | 1.6 | 1.6 | 1.2 | 1.0 | 1.5 | 1.6 | 1.5 |
| Personal & other services | 1.8 | 1.7 | 2.1 | 1.6 | 2.2 | 2.2 | 1.8 |
| Government | 3.7 | 2.6 | 4.3 | 2.4 | 3.5 | 5.6 | 4.0 |
|
Source: ABS |
|||||||