Bulletin – October 2005 Survey on Housing Equity Withdrawal and Injection
Over the past few years, household borrowing against the stock of housing has increased by more than household spending on new housing and renovations. As a result, the household sector has effectively extracted equity from the housing stock, though the net amount withdrawn has recently been declining. The significant equity withdrawal over 2001 to 2004 stands in contrast to experience in previous decades when households, in aggregate, built up their equity in the housing stock, by using income or assets to finance some of their spending on new housing and renovations. This change from households injecting equity to withdrawing equity coincided with strong consumption growth and a decline in the household saving rate.
Earlier this year the Bank commissioned an extensive survey to better understand how households were withdrawing equity from the housing stock, and how the withdrawn funds were being used. The survey covered housing-related expenditures and transactions in 2004. This article reports the main results of the survey, and briefly discusses some implications of trends in housing equity withdrawal for broader economic activity.
The results of the survey suggest that:
- Any aggregate series for net housing equity withdrawal or injection masks large aggregate withdrawals and injections by different types of households.
- There was significant equity withdrawal in 2004 via the refinancing of existing mortgages and products such as home-equity loans.
- The bulk of equity withdrawal in 2004 was associated with transactions in the property market. Equity withdrawal through this channel typically occurs when households that have partly or fully paid down their mortgages sell to purchasers who take out larger new mortgages: this partly reflects life-cycle patterns of older households selling to younger households. It is likely that high turnover in the property market over 2001 to 2003, combined with rapid house price growth, explains why aggregate net housing equity withdrawal was particularly strong over that period.
- Around two-thirds of equity withdrawn in 2004 was invested in other assets or used to pay down other loans. In contrast, only a relatively small proportion of equity withdrawn was used to fund consumption. This implies that swings in housing equity withdrawal in recent years are likely to have had a smaller impact on aggregate household consumption than the raw figures on aggregate net household equity withdrawal would suggest.
Survey Details
The survey was conducted in January and February this year, with the assistance of Roy Morgan Research (RMR). The Bank initially wrote to around 11,000 households – drawn from RMR's database on a geographically representative basis – requesting their assistance and assuring them that individual responses would be kept strictly confidential. The Bank's letter was followed up by a telephone call from RMR to each of these households to ask a number of questions about the household's finances and property transactions. All up, around 4,500 households agreed to participate in the survey
Given the various ways that households can withdraw or inject equity, the survey was inevitably complex, with the average time taken to complete the survey being around eight minutes. Households were asked about all property transactions during the 2004 calendar year, including the financing of those transactions. They were also asked about changes in the amount of debt outstanding on any existing property holdings. Based on these responses, it was possible to calculate whether households had withdrawn or injected housing equity. Where households made a net withdrawal of equity over the year, they were asked what they did with the proceeds.
The survey was not designed primarily to measure aggregate housing equity withdrawal, but to provide information about the means by which different types of households withdraw and inject equity, and how the proceeds of equity withdrawal are used. The survey results provide a snapshot of household behaviour in 2004, but do not provide similar information for earlier years.
How Was Equity Withdrawn and Injected?
According to the survey, 11.7 per cent of households made a net withdrawal of equity over 2004, while around 30 per cent made a net injection of equity over the year. The remaining households neither withdrew nor injected equity, largely because they did not own any property, or had fully paid off the property that they owned.
In analysing the results it is useful to classify households that were either net withdrawers or net injectors of equity over 2004 into three broad groups. The first group consists of those households that withdrew equity by increasing debt on existing property. This form of withdrawal is the stereotypical way of withdrawing equity, and typically involves either refinancing and increasing the size of a standard home loan, or drawing down a home-equity style loan. The second group consists of those households that injected equity by paying down principal on existing debt or by financing renovations, at least partly, from their own funds. And the third group consists of those households that engaged in one or more transactions in the property market in 2004 and withdrew or injected equity. This group includes: households reducing their property holdings (typically withdrawing equity); households increasing their property holdings, often as a first-home buyer or an investor (typically injecting equity); and those that were both buyers and sellers (either withdrawing or injecting equity). For the bulk of property transactors, the housing equity flows associated with their transactions were the main driver of whether they made a net withdrawal or injection over 2004.
Around 7¼ per cent of households fell into the first group – that is, those withdrawing their equity by increasing their debt on existing property. For these households, the median increase in debt over the year was $20,000 (Table 1). A much larger number of households fell into the second group; 19 per cent of households injected equity through scheduled and additional payments on their housing loans, and a further 6½ per cent injected equity by financing renovations, at least partly, from their own savings. The median size of these injections was considerably smaller than the median size of the withdrawals made by those households increasing debt on existing property.
| Share of all households Per cent |
Median amount $ |
|
|---|---|---|
| Withdrawal of equity by increasing debt | 7.3 | −20,000 |
| Injection of equity by | ||
| – paying down debt | 19.0 | 9,000 |
| – renovating | 6.5 | 14,000 |
| Property transactors | ||
| – withdrawing equity | 4.4 | −82,700 |
| – injecting equity | 4.6 | 55,100 |
|
Source: RBA |
||
The number of households involved in property transactions and either withdrawing or injecting equity was considerably smaller than the numbers in the other two groups, although the median amounts they withdrew or injected were much larger. Around 9 per cent of households reported being involved in a property transaction in 2004, which is broadly consistent with the available housing turnover data. These households were almost equally split between those withdrawing and injecting equity. For those households involved in a property transaction that withdrew equity, the median amount withdrawn was around $83,000, while the median amount injected was around $55,000.
Households withdrawing equity
Almost three-quarters of the total value of equity withdrawn by households that withdrew equity (in net terms) over the course of 2004 was attributable to households that were involved in property transactions, rather than to households undertaking additional borrowing secured against existing property (Table 2). This reflects the fact that while relatively few households undertake property transactions in a given year, the values involved are typically quite large. Households withdrawing equity in this way tended to be those selling more properties than they bought, either through selling their principal place of residence or an investment or second property. The median amount withdrawn by these households was $126,000.
| Share of all households |
Share of amount withdrawn |
|
|---|---|---|
| Increasing debt on existing property | 7.3 | 27.9 |
| Of which: | ||
| – refinancing and new loans | 4.5 | 20.3 |
| – redraw facilities | 1.4 | 3.0 |
| – revolving credit | 0.7 | 3.4 |
| – withdrawal from offset account | 0.3 | 0.6 |
| – can't say/other | 0.5 | 0.6 |
| Property transactors | 4.4 | 72.1 |
| Of which: | ||
| – sold more properties than bought(b) | 2.7 | 54.1 |
| – bought more properties than sold | 0.9 | 10.7 |
| – bought and sold equal number of properties | 0.8 | 7.4 |
| – downsized | 0.4 | 4.3 |
| – upsized | 0.3 | 3.0 |
|
(a) Components may not sum due to rounding errors. Calculations involve
some imputation. Source: RBA |
||
In addition to those households that withdrew equity over 2004 while reducing their property holdings, there was a smaller number of households that withdrew equity while adding to their property holdings, by increasing their debt by more than the value of their additional property. Some households also withdrew equity when buying and selling property, with roughly equal numbers of these households downsizing to a cheaper property as opposed to upsizing to a more expensive property.
Of the households that withdrew equity by increasing debt on existing property, by far the most common way of doing this was to refinance an existing loan and increase the balance outstanding. The other two common forms of withdrawing equity were drawing upon previous excess principal payments and drawing on a revolving or home-equity type facility. Though twice as many households withdrawing equity used redraw facilities as used revolving credit lines, the amounts withdrawn through redraw facilities tended to be relatively small, so that these two methods accounted for broadly similar values of withdrawal in aggregate.
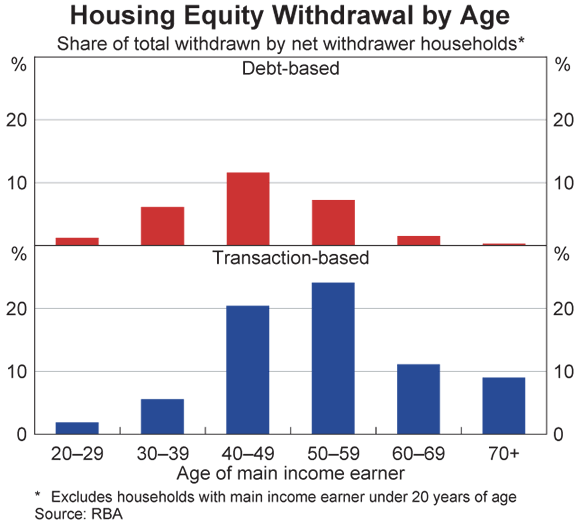
There are considerable differences in demographic characteristics between those households that withdrew equity through increasing debt on an existing property and those that withdrew equity through transactions in the property market. In particular, those in the latter group tended to be considerably older (Graph 1). Just over half of the households that withdrew equity through a property transaction had a main income earner over the age of 50, with this over-50 group accounting for 44 per cent of the total value of equity withdrawn. In contrast, there were relatively few older households increasing debt on existing properties; households with a main income earner in their forties were the main withdrawers through this channel.
Households injecting equity
In contrast to the results for households withdrawing equity, total net equity injections by value were split fairly equally between a small number of households undertaking property transactions and making large injections, and a large number of households making small injections by paying down debt or financing renovations using savings (Table 3).
| Share of all households |
Share of amount injected |
|
|---|---|---|
| Reducing debt on existing property | 19.0 | 32.5 |
| Of which: | ||
| – regular repayments of principal | 9.6 | 10.4 |
| – regular repayments greater than | ||
| minimum required | 6.7 | 10.6 |
| – irregular lump-sum payments | 2.1 | 8.4 |
| – refinanced loan | 0.3 | 1.7 |
| – increased offset account balance | 0.0 | 0.0 |
| – can't say/other | 0.2 | 1.3 |
| Renovators | 6.5 | 18.3 |
| Property transactors | 4.6 | 49.3 |
| Of which: | ||
| – sold more properties than bought | 0.4 | 2.0 |
| – bought more properties than sold | 3.6 | 41.0 |
| – bought and sold equal number of properties | 0.6 | 6.2 |
| – downsized | 0.0 | 0.4 |
| – upsized | 0.6 | 5.8 |
|
(a) Components may not sum due to rounding errors. Calculations involve some imputation. Source: RBA |
||
Within the 19 per cent of households that injected equity by reducing debt on their existing property, 9.6 per cent of households reported that they simply made the regular scheduled repayments, while an additional 6.7 per cent reported that they made regular repayments above those required by their lender. A further 2.1 per cent indicated that they made irregular lump-sum repayments, financed from a range of sources including the sale of other assets, savings, an inheritance, a gift, or a redundancy payout. These one-off lump-sum payments tended to be relatively large, so that they accounted for a disproportionately high share of the amount of equity injected.
In addition to those households injecting equity by paying down their mortgage, 6½ per cent of households injected equity through financing renovations, at least partly, from their own savings. In total, this amounted to around 18 per cent of the total amount of equity injected by households that made a net injection over 2004. Not all households conducting renovations injected equity though, with some borrowing more than the cost of the renovations, using the proceeds for a variety of purposes, including home decorations.[1]
Around half of the equity injected came from the 4.6 per cent of households that undertook a property transaction and injected equity. Most of these households purchased more properties than they sold, as either a first-time buyer or an investor. The median amount injected by these households was around $59,000, which was almost 20 per cent of the median dwelling price in 2004.
The importance of property transactions and life-cycle factors
The above results underline the importance of property transactions and the life cycle in understanding both gross and net equity withdrawals. When turnover in the property market is unusually high, and prices have increased, the net amount of equity withdrawn is likely to rise. This link between turnover and equity withdrawal reflects the fact that in the typical property transaction, the seller of a property has less debt remaining on the property when it is sold than the debt taken on by the purchaser of the property. A stylised example is that of an elderly household selling a property to a first-home buyer. In this case, the elderly household is likely to have paid down debt and experienced a capital gain, leaving considerable equity to be withdrawn, while the first-home buyer's equity injection is typically a modest deposit. The disparity between the amount withdrawn and the amount injected is likely to increase after a period of large rises in housing prices.
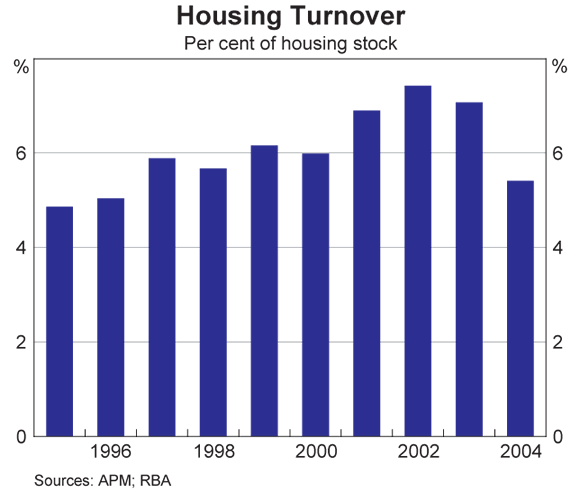
The importance of transaction-related housing equity withdrawal in the survey results for 2004 is noteworthy given that the turnover rate of the national housing stock dropped to 5½ per cent in that year, from around 7 to 7½ per cent in each of the previous three years (Graph 2). The more rapid turnover during 2001 to 2003, combined with the large price increases from the mid to late 1990s, helps explain why housing-secured credit and estimates of aggregate equity withdrawal grew so strongly over the period 2001 to 2003.
What Did Households Do with the Equity Withdrawn?
The survey asked households that made a net withdrawal of equity over 2004 what they did with the funds withdrawn. Respondents were prompted with a number of possible answers, including using the funds for various types of consumption, the purchase of various assets, and the repayment of non-housing related debt. While most of these households provided a response, around 14 per cent indicated that they could not (or would not) say what the funds had been used for. Overall, the results indicate that, while a significant share (18 per cent) of the equity they withdrew over the year was used mainly for consumption-type expenditure, the bulk (58 per cent) of the funds were used mainly for asset accumulation, with an additional amount (8 per cent) used to pay down other debt (Table 4).
| Borrowing against existing property |
Property transactors |
All methods |
||||
|---|---|---|---|---|---|---|
| Share of all households |
Share of amount withdrawn by this method(b) |
Share of all households | Share of amount withdrawn by this method(b) | Share of all households |
Share of total amount withdrawn(b) |
|
| Household expenditure | 3.4 | 29.7 | 0.7 | 13.0 | 4.0 | 17.6 |
| Of which: | ||||||
| – Redecorations/durables etc | 1.5 | 13.0 | 0.3 | 6.9 | 1.8 | 8.6 |
| – Holiday | 0.5 | 2.9 | 0.2 | 1.3 | 0.6 | 1.7 |
| – Car | 1.3 | 12.0 | 0.2 | 3.6 | 1.5 | 5.9 |
| – Living expenses | 0.1 | 1.8 | 0.1 | 1.2 | 0.2 | 1.4 |
| Asset accumulation | 1.6 | 41.0 | 2.3 | 65.2 | 3.9 | 58.5 |
| Of which: | ||||||
| – On deposit | 0.6 | 18.6 | 1.3 | 38.6 | 1.9 | 33.0 |
| Repay other debt | 0.7 | 8.3 | 0.4 | 7.4 | 1.2 | 7.7 |
| Other/something else | 0.6 | 4.6 | 0.4 | 7.1 | 1.0 | 6.4 |
| Can't say | 1.1 | 16.4 | 0.6 | 7.3 | 1.7 | 9.8 |
| Total | 7.3 | 100.0 | 4.4 | 100.0 | 11.7 | 100.0 |
|
(a) Components may not sum due to rounding errors. Calculations involve
some imputation. Source: RBA |
||||||
The results also show that the use of funds varied considerably with the method of equity withdrawal, with households borrowing against existing property much more likely to use the funds to finance consumption than were households withdrawing equity through a property transaction.
Of those households that increased debt on an existing property and identified a specific use for the withdrawn equity, around 55 per cent indicated consumption, with these households using the funds for a variety of purposes, including home decorations, holidays, consumer durables and motor vehicles. A further 5 per cent of households withdrawing equity in this way cited consumption as a use, but not the main use, of the withdrawn equity.
In contrast, only 18 per cent of households withdrawing equity through a property transaction, and identifying a specific use for the withdrawal, indicated that the main use was to finance consumption. The more typical response was that the funds withdrawn were allocated to other assets, such as equities, superannuation, household businesses and commercial property. A number of households indicated that they placed the withdrawn funds in bank deposits, although in some of these cases the household indicated that these funds would later be used for other investments.
Impact on Economic Activity
Assessing the overall impact of changes in household borrowing and in the rate of equity withdrawal on consumption is difficult, with any estimates clearly dependent on a number of assumptions. Furthermore, it is unclear to what extent the results from the 4,500 survey respondents can be extrapolated to provide reliable estimates for the aggregate level of equity withdrawal or injection (see Attachment). As with other surveys, there will always be some divergences between the aggregated responses to the survey and other macroeconomic data.
Notwithstanding these qualifications, an extrapolation of the survey results suggests that, in 2004, around $20 billion was withdrawn by Australian households increasing debt on existing properties, with at least $6 billion of this being used to finance consumption. This latter figure is equivalent to around 1¼ per cent of the level of consumption expenditure in 2004. In addition, some of the equity withdrawn in property market transactions was reported to have been used to finance consumption (although the bulk of the funds withdrawn in this way appears to have been allocated to other assets).
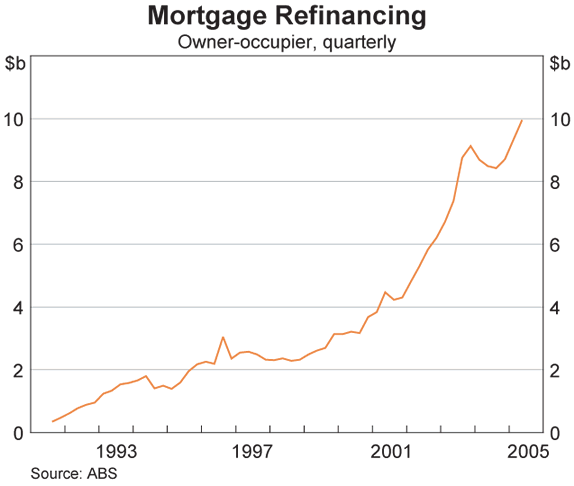
Given the nature of the survey, it cannot provide estimates of the year-by-year effects of housing equity withdrawal on consumption growth. However, the rapid growth in mortgage refinancing in 2002 and 2003 suggests that larger contributions to consumption growth from the withdrawal of equity probably occurred in those years (Graph 3). This conclusion is supported by data on borrowing through home-equity line-of-credit products, which show growth of around 30 per cent over 2003. The conclusion is also consistent with the fact that consumption growth outpaced growth in household disposable income by a reasonable margin during 2002 and 2003. However, estimates of the overall effect of aggregate housing equity withdrawal on consumption would also need to take account of any changes in the pattern of equity injection by those households buying a new property or paying down their existing mortgage. We have little information about such changes, and it is difficult to judge if greater mortgage flexibility and the growth in wealth and income of recent years would have resulted, on balance, in an increase or decrease in the speed of mortgage repayment.
Overall, although the survey provides only a snapshot for 2004, the results suggest that swings in recent years in the amount of equity withdrawn or injected by the household sector probably did not result in swings of a corresponding magnitude in consumption growth. To a significant extent, the changes in the amounts withdrawn or injected are likely to have been the result of changes in turnover in the property market and the longer-term growth in prices. The results of the survey indicate that withdrawals of equity through transactions were not typically used for consumption but were instead used to accumulate other assets.
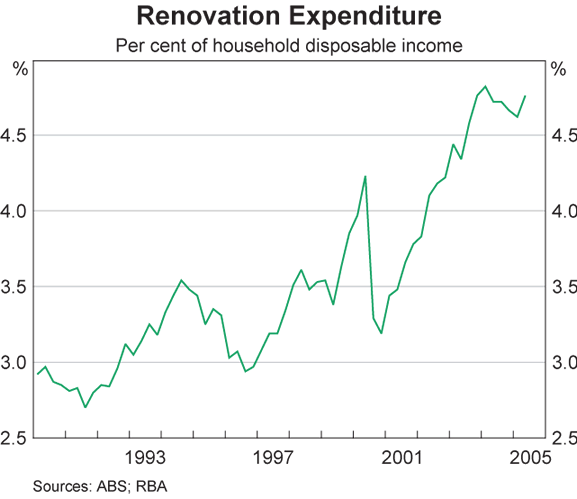
A second channel through which swings in household borrowing affect economic activity is spending on renovations. However, borrowing to finance this form of spending does not necessarily lead to the withdrawal of equity, as the borrowed funds can be used to increase the value of the household sector's housing assets. Nevertheless, the effect on overall activity can be significant. Over recent years, annual spending on renovations has averaged the equivalent of 4.6 per cent of household disposable income, up from an average of 3.1 per cent between 1990 and 1998 (Graph 4).
The survey suggests that in many cases renovations have been funded, at least partly, from the increased equity built up as a result of the large increases in house prices over recent years. The survey indicates that around 11 per cent of households spent money on renovations in 2004, with the median amount spent on the main home equal to $13,500. Around 40 per cent of these households used housing debt to at least partly finance their renovation expenditure, with debt finance being used more often for larger renovations. As with the households increasing debt on an existing property for other purposes, households borrowing to finance renovations typically did so by refinancing an existing loan.
Conclusion
Swings in household borrowing have the potential to have a significant effect on the economy. Over recent years, a concern has been that a downturn in the housing market could cause households to reassess their financial positions, prompting a sharp slowing in consumption growth. One reason for this concern was that since the mid 1990s, household consumption has grown faster than household disposable income, and that over recent years, in contrast to previous experience, housing-related borrowing has exceeded spending on new housing and renovations, i.e. equity had been withdrawn and used for other purposes.
While high levels of indebtedness increase the vulnerability of the household sector, the Bank's recent survey suggests that large swings in housing credit growth and housing equity withdrawal need not be associated with large swings in consumption. In particular, the results suggest that the bulk of equity withdrawn through property transactions has been used for accumulation of other assets or to pay down other debt, rather than for current consumption. The results also suggest that changes in the rate of turnover in the property market, combined with the cumulative house price rises since the mid to late 1990s, are likely to have been the principal influences on recent movements in aggregate housing equity withdrawal. As turnover has slowed, it is not surprising that growth in housing-related credit has also slowed.
However, the survey results do confirm that a significant number of households have used refinancing opportunities over recent years to increase the size of their outstanding debts, both for the purpose of consumption and financing renovations. One result of this is that consumption and renovation spending have both, until quite recently, trended up as a share of GDP. Accordingly, in the period ahead, it will be important to monitor trends in both housing turnover and refinancing to help understand the implications of changes in household credit growth and housing equity withdrawal for the overall economy.
Attachment: Measures of Aggregate Net Equity Withdrawal
The survey was designed primarily to provide information about the means by which different types of households withdraw and inject equity, and how the proceeds of equity withdrawal are used. Nevertheless, it is of interest to see how the implied aggregate amount of equity withdrawal or injection compares with measures based on macroeconomic data.
Conceptually, at the macroeconomic level, the amount of equity withdrawn or injected is the difference between the change in the household sector's total debt secured against the housing stock, and the net spending by the household sector on new housing, renovations, and transfer costs associated with property transactions. While the change in debt can be readily estimated from published statistics, calculating total spending on new housing and renovations is more difficult. A commonly used measure of this spending is the value of dwelling investment (plus transfer costs such as stamp duty, legal and real estate agent fees).[2] Using this measure suggests that, since 2000, the household sector has consistently increased housing-secured credit by more than it has spent on dwelling investment and therefore withdrawn equity, with the amount withdrawn averaging just over 5 per cent of household disposable income (Graph 5). In 2004 – the year the survey covers – the estimated amount withdrawn using this calculation was around $25 billion, equivalent to 4.8 per cent of household disposable income. In contrast, up until the late 1990s, it was typical for the household sector to inject equity, with the amount injected per year, on average, equivalent to around 4 per cent of household disposable income.
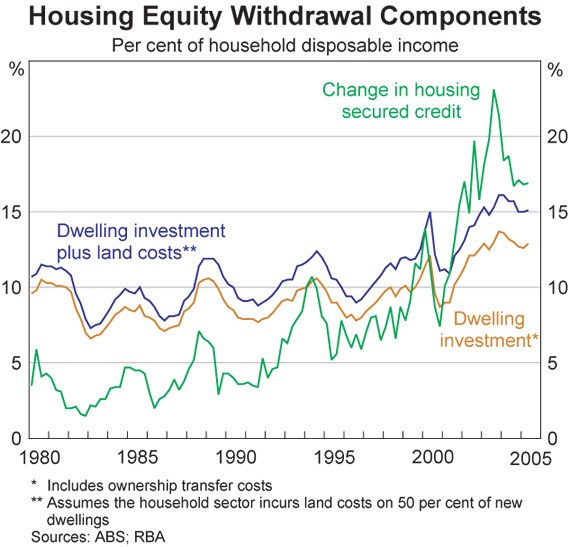
Despite its common use as a measure of household spending on new housing and renovations, the value of dwelling investment is an underestimate of this spending. In particular, the land content (both the cost of undeveloped land and development costs) of a new dwelling typically represents a significant part of the purchase price. If the land is purchased from the business or government sector, then its cost should also be included in calculations of household housing equity withdrawal. It is possible to come up with an alternative calculation of aggregate housing equity withdrawal under the assumption that all new dwellings are built on land purchased from other sectors. Under this assumption, the estimates for 2004 would have actually implied a small net injection of housing equity.
However, only part of the land for new dwellings is purchased from other sectors, with a significant fraction representing a transfer within the household sector. Detailed time-series data on the source of land are not available, but a reasonable estimate might be that 50 per cent of the land content of new dwellings should be included in calculations of housing equity withdrawal and injection. Based on estimates of the value of the land content of new housing, this would suggest that aggregate housing equity withdrawal in 2004 was around $12 billion, or 2.3 per cent of household disposable income (Graph 5). Making this adjustment for land costs in history would suggest an increase in net equity injection relative to the traditional measure, although the general pattern would be little changed.
The Bank's survey provides an alternative way to measure the total amount of equity withdrawn in 2004, although the results are inevitably subject to considerable sampling error, given the relatively small size of the sample, and in particular the small number of property transactions captured in the survey. Bearing this caveat in mind, the survey suggests that in 2004 the amount of equity withdrawn by households that were net withdrawers of equity over the year was around $73 billion, with this being more than offset by an injection of $86 billion by those households injecting equity. The net outcome, representing an injection of $13 billion (equivalent to 2½ per cent of household disposable income), stands in contrast to the small net withdrawal obtained from the central aggregate measure discussed above. It is likely that this difference partly reflects the fact that, when appropriately scaled up, the change in debt reported by survey respondents is considerably less than the change in debt obtained from the aggregate statistics. In turn, this may reflect some under-reporting of debt in the survey, an outcome that has been observed in surveys of household debt in the United Kingdom.[3]
Footnotes
Attempts were made throughout the survey to ensure that renovation spending captured alterations of a structural nature, as opposed to spending on redecorations and maintenance such as repainting or new blinds. [1]
This is also the measure that has been used by the Bank of England and several other central banks. [2]
See Redwood V and M Tudela (2004), ‘From tiny samples do mighty populations grow? Using the British Household Panel Survey to analyse the household sector balance sheet’, Bank of England Working Paper No 239. [3]