Bulletin – December 2012 Households' Interest-bearing Assets
- Download the article 285KB
Abstract
Households invest around two-fifths of their financial assets in interest-bearing assets. These assets are predominantly held directly in deposits and also via superannuation and other investment funds. Deposits have grown strongly in recent years, although there has been no growth in interest-bearing securities. Compared with other advanced economies, interest-bearing assets represent a relatively small share of financial assets. For the household sector as a whole, interest-bearing assets are lower in value than debt, so household disposable income increases as interest rates decline. Interest-bearing assets tend to be held by retirees, while younger households are more likely to be in debt. Interest-bearing assets are expected to rise over time as the population ages.
Introduction
Households invest in deposits and interest-bearing securities, such as bonds and bank bills, since they are relatively secure assets and provide a relatively stable flow of income. Households tend to borrow when young to finance education and home ownership, generally maintaining modest deposits to facilitate transactions. As they age, households pay off their debts and accumulate financial assets to finance retirement. Retirees tend to seek more stable income streams, which can in part be provided through investments in deposits and other interest-bearing assets. It is unsurprising, therefore, that older households invest more than younger households in these assets, both in total and as a share of their financial assets.
The distribution of interest-bearing assets and income a cross households is important for understanding one way in which movements in interest rates affect household income and spending. A reduction in interest rates boosts the cash flows of households with debt, while reducing the cash flows of households with interest-bearing assets.[1] Because the total value of household sector debt is larger than households' interest-bearing assets, lower interest rates increase cash flows for the sector as a whole. Furthermore, a change in cash flows for households with debt is more likely to influence spending than for households with substantial interest-bearing assets, as the former are more likely to be liquidity constrained.[2] Nevertheless, households with interest-bearing assets may still reduce their spending in response to lower interest rates, particularly if they are seeking to preserve their assets as a financial buffer against unanticipated events, such as medical expenses, or as a bequest.
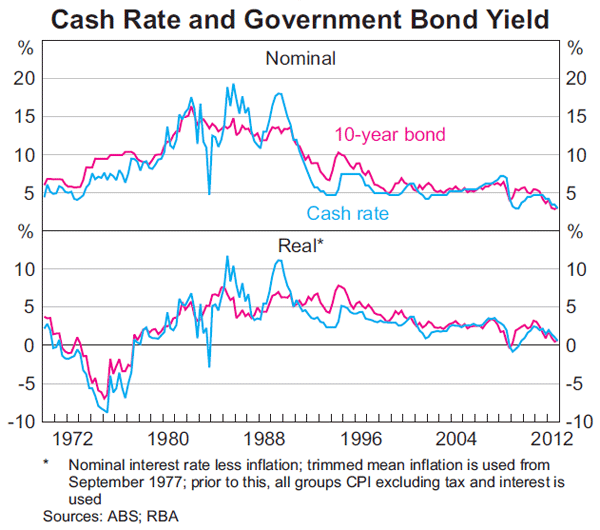
Over recent years, Australian government bond yields have fallen to their lowest levels since Federation and the cash rate has been reduced to be clearly below its average of the past 16 years (Graph 1). When comparing interest rates over time, it is also important to take into account consumer price inflation since high inflation erodes the purchasing power of interest-bearing assets. While nominal interest rates are low currently, real interest rates are well above the levels that prevailed during the 1970s, when nominal interest rates were actually below the rate of inflation. Furthermore, over recent years, deposit rates have not declined to the same extent as the cash rate due to competition between banks to attract deposits.[3] Even so, interest rates in both nominal and real terms are lower now than their average over the past 16 years. While low interest rates have an adverse effect on households that rely on interest income, an important part of the monetary policy transmission mechanism is for low interest rates to support the prices of other assets, such as equities and property, and by encouraging households to rebalance their portfolios away from interest-bearing assets towards those with higher returns.[4]
Aggregate Trends in Interest-bearing Assets
The household sector owns around $1.2 trillion in interest-bearing assets, both directly and indirectly via superannuation and other investment funds, representing around two-fifths of household financial assets (Table 1). Around three-quarters of these assets are deposits, while the remainder are securities such as bonds and bank bills.
| June 2012 | Annual growth (per cent) | ||
|---|---|---|---|
| $ billion | 2002–2007 | 2007–2012 | |
| Interest-bearing assets | 1,231 | 11 | 8 |
| Deposits(b) | 938 | 12 | 11 |
| Directly held | 702 | 10 | 12 |
| – Deposits at call | 232 | 9 | 8 |
| – Term deposits | 470 | 11 | 14 |
|
Indirectly held in superannuation and other investment funds |
236 | 19 | 11 |
| Securities(c) | 293 | 10 | 0 |
| Directly held | 7 | 0 | −15 |
|
Indirectly held in superannuation and other investment funds |
286 | 11 | 0 |
| – Short-term securities | 84 | 12 | −6 |
| – Long-term securities | 202 | 11 | 4 |
| Memo items: | |||
| Debt | 1,600 | 14 | 7 |
| Total financial assets | 3,109 | 16 | 3 |
| Disposable income(d) | 1,054 | 8 | 7 |
|
(a) Data are at the end of the financial year. The household sector includes
unincorporated enterprises. Households' interest-bearing assets indirectly
held are measured as the sum of the interest-bearing assets of pension
funds, life offices, money market financial investment funds and non-money
market financial investment funds. These are referred to collectively
as superannuation and other investment funds, and are predominantly owned
by households (according to the Australian Bureau of Statistics (ABS)
financial accounts, in
June 2012: households held 99.9 per cent of the equity in pension
funds; households and pension funds held 95 per cent of the equity in
life offices; households, pension funds and life offices held 98 per cent
of the equity in money market financial investment funds and
84 per cent of the equity in non-money market financial investment
funds). Sources: ABS; RBA |
|||
Household deposits have grown consistently over the past decade at a rate of around 12 per cent per year, considerably faster than the growth in household income. Over the first half of this period, household balance sheets were expanding rapidly, driven by rising debt and asset prices, while deposits grew at a slower rate than household debt and total financial assets. However, since 2007, households have become more risk averse in response to volatile financial markets and more uncertain economic conditions, with the household net saving ratio rising from around zero in the mid 2000s to around 10 per cent in recent years.[5] Consistent with this, deposits have grown faster than debt and total financial assets over this period.
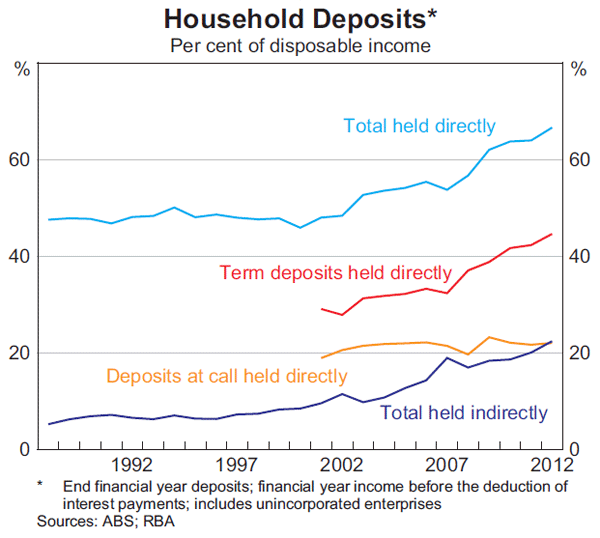
Over the past decade, households have increased their deposits both directly and indirectly via superannuation and other investment funds (Graph 2). Household deposits held directly are predominantly invested in term deposits; the growth in term deposits has been particularly strong over recent years, partly supported by competition between banks to attract deposits through higher interest rates relative to the cash rate (Deans and Stewart 2012). In comparison, deposits at call, which are used to facilitate transactions, tend to attract lower interest rates and have been relatively stable as a share of income over recent years. The growth in deposits in superannuation and other investment funds partly reflects the ageing of the population, with older households tending to prefer relatively safe investments such as deposits. In APRA-regulated superannuation funds, the share of assets held by members who are at least 60 years old increased from a quarter in 2007 to almost a third in 2011. In addition, there has been strong growth in self-managed superannuation funds over recent years, which have a much larger share of older members and a significantly higher allocation of assets to deposits than APRA-regulated superannuation funds (Super System Review 2009).
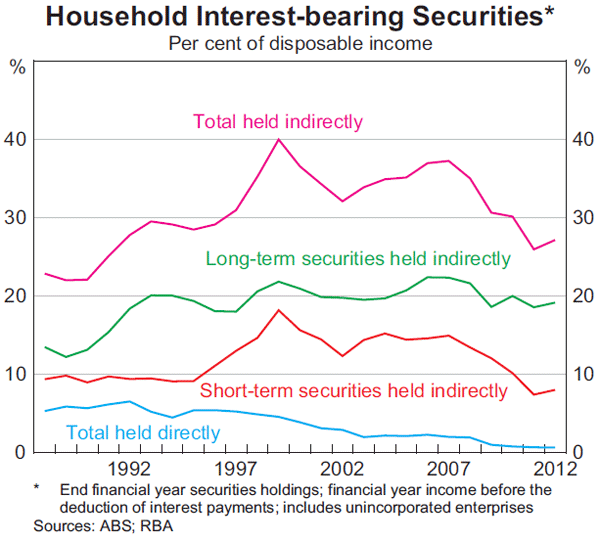
Part of the growth in deposits has been due to households shifting their portfolios away from interest-bearing securities, such as bonds and bank bills. Around one quarter of households' interest-bearing assets are securities held in superannuation and other investment funds. After growing at a similar rate to deposits over the period from 2002 to 2007, there has been no growth in these securities since then (Table 1). Households' direct holdings of securities are very small relative to income, and have also fallen over the past five years (Graph 3). Part of the explanation for this is that banks have significantly reduced their issuance of short-term interest-bearing securities, with deposits becoming a more preferred source of funding. Consistent with this, short-term interest-bearing securities held by superannuation and other investment funds have fallen over the past five years. There has still been some growth in long-term securities, although at a much slower rate than the growth in deposits. This may partly reflect the fact that bond yields internationally have been relatively low over the past couple of years – particularly the yields on government bonds in the major advanced economies and Australia – encouraging households and superannuation funds to reallocate their portfolios towards higher-yielding assets, including deposits.[6]
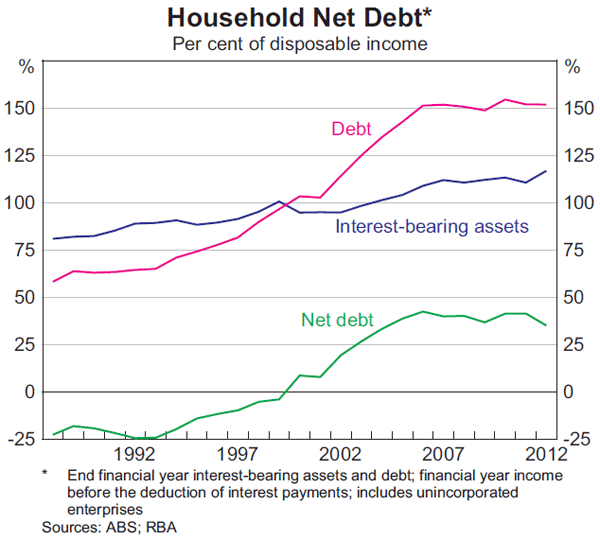
The shift in household borrowing and saving behaviour over recent years has resulted in a marked change in household debt relative to income (Graph 4). After rising steadily through the 1990s and the early 2000s, the household debt-to-income ratio has stabilised at around 150 per cent of disposable income since 2006. Slightly faster growth in interest-bearing assets since around that time has resulted in net debt (household debt minus interest-bearing assets) declining from 42 per cent in 2006 to 35 per cent in 2012. This implies that, in aggregate, the net effect of a change in interest rates on the cash flows of the household sector as a whole would have diminished slightly over recent years, to be closer to where it was in the early 2000s.[7]
Cross-country Comparison
Despite the strong growth in household deposits over recent years, the share of financial assets invested in interest-bearing assets in Australia remains low compared with other advanced economies. Australian households increased the share of their financial assets directly invested in deposits from 20 per cent in 2006 to 26 per cent in 2011 (Graph 5). While the share of deposits in financial assets also rose in most comparable countries – reflecting the fall in the value of equities and the rising preference for safer assets – the increase was largest in Australia.[8] Nevertheless, Australian households directly invest a relatively small share of their financial assets in interest-bearing assets, partly owing to them holding very few interest-bearing securities.
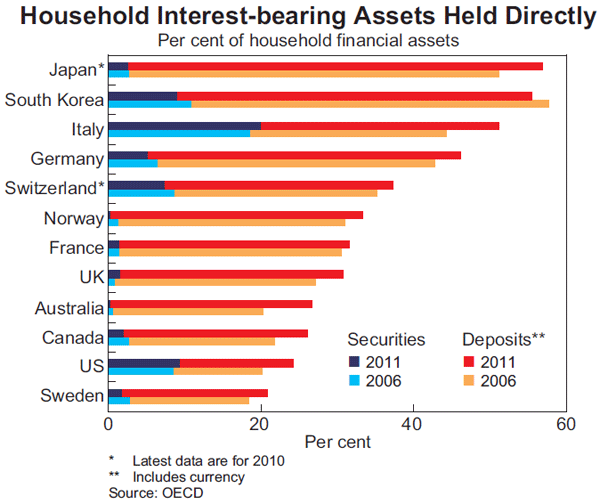
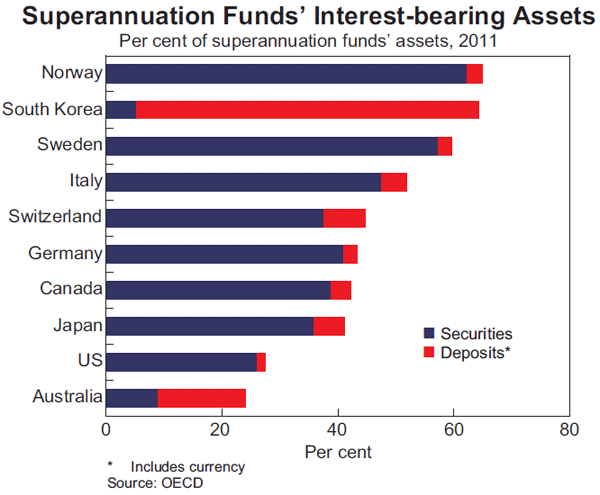
Australian households hold over 60 per cent of their financial assets in superannuation funds, which is high compared with other OECD countries. While this partly explains Australian households' relatively modest direct holdings of interest-bearing assets, superannuation funds' allocation to these assets is also small relative to comparable countries and reflects a relatively low allocation to interest-bearing securities (Graph 6).[9]
Distribution across Households
The distribution of interest-bearing assets and income across households can be examined using data from the Household, Income and Labour Dynamics in Australia (HILDA) survey and the Survey of Income and Housing (SIH). HILDA is a panel survey of around 7,000 households conducted annually since 2001; the survey in 2010 also included a wealth module asking respondents detailed questions about their assets and liabilities. The SIH is conducted by the ABS every two years, with the latest survey in 2009/10 involving around 18,000 households. These data can shed light on the composition and distribution of households' income, assets and liabilities.
In this analysis, two separate categories of household interest-bearing assets are considered: deposits, which comprise bank accounts and a small amount of cash investments; and superannuation. Although only a minority of the assets in superannuation funds are interest bearing, it is important to include superannuation in the analysis given that it is the largest financial asset of the household sector, and an important source of retirement income for many households.
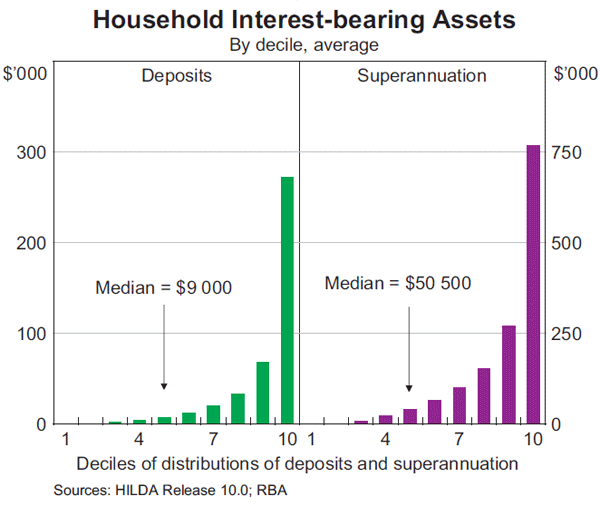
The distribution of deposits and superannuation is far from uniform. The distributions are heavily skewed, with wealthy households at the extreme tail of each distribution having a significant influence on aggregate statistics (Graph 7). In 2010, the median household held around $9,000 in deposits and $50,500 in superannuation; by comparison, households in the top asset deciles on average held $271,700 and $768,700 in deposits and superannuation, respectively.
Households with larger deposits tend to be older, retired, and own their homes outright (Table 2). In contrast, households with smaller deposits tend to be younger, rent a home or have a mortgage and are less likely to be employed or retired. The demographic pattern is similar for superannuation, except that the median retiree in 2010 did not have superannuation, since prior to the introduction of the compulsory system between 1986 and 1992, the proportion of workers covered was only around 40 per cent; since then, the proportion of workers with superannuation has risen to over 90 per cent. Therefore, as the current cohort of workers retires, their superannuation balances will be significantly larger than the previous cohort of retirees.[10] Given that a portion of superannuation is invested in interest-bearing assets, these assets are likely to increase over time as a share of household financial assets.
| Deposits | Superannuation | |||
|---|---|---|---|---|
| Median | Average | Median | Average | |
| Employment status | ||||
| Employed | 8.6 | 36.9 | 75.0 | 164.4 |
| Unemployed | 0.4 | 13.9 | 9.0 | 41.0 |
| Not in the labour force – non-retired | 2.6 | 27.7 | 5.0 | 65.9 |
| Not in the labour force – retired | 16.0 | 64.7 | 0.0 | 104.5 |
| Tenure status | ||||
| Renter or rent-free | 3.0 | 24.9 | 20.0 | 51.8 |
| Mortgagee | 7.0 | 21.3 | 85.0 | 149.4 |
| Own outright | 24.8 | 72.9 | 78.9 | 218.3 |
| Age of household head | ||||
| 15–29 | 4.5 | 22.5 | 21.0 | 52.8 |
| 30–44 | 6.0 | 26.9 | 63.0 | 102.9 |
| 45–59 | 12.0 | 40.3 | 120.0 | 212.2 |
| 60+ | 19.0 | 72.3 | 0.0 | 175.8 |
| All households | 9.0 | 41.2 | 50.5 | 142.3 |
|
Sources: HILDA Release 10.0; RBA |
||||
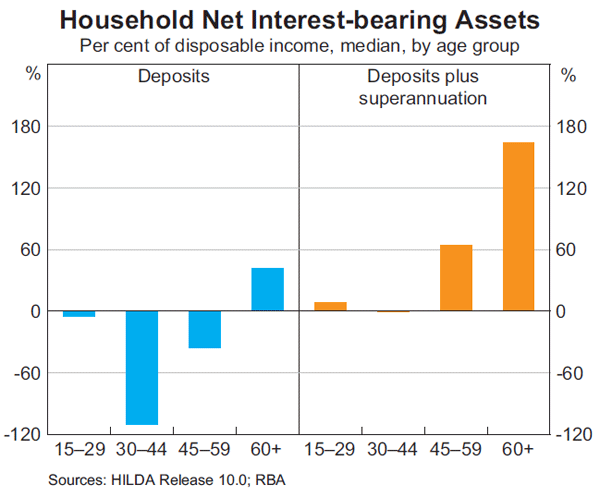
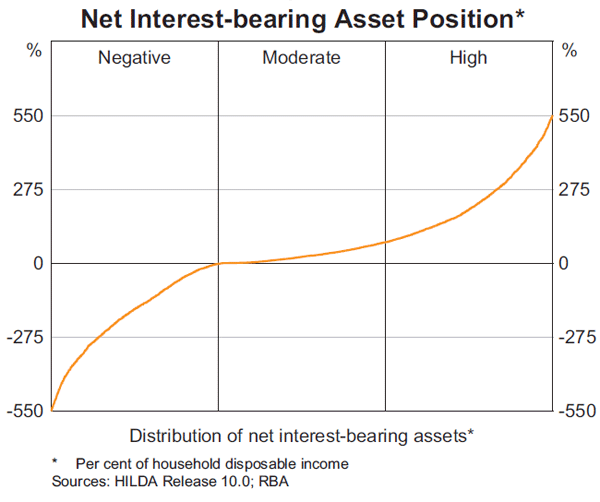
The differences in the portfolios of older and younger households is even more pronounced in the case of net interest-bearing assets – that is, interest-bearing assets minus household debt (Graph 8).[11] By age, younger households have net debt, particularly those where the household head is aged 30 to 44 years, while older households have positive net interest-bearing assets. These results accord with changes in a household's financial situation through their life cycle. Younger households take on debt to fund their education and purchase property, before paying down the debt over their working lives, while older households shift their portfolios towards safe assets to reduce financial risks in old age.[12] The shape of the net asset distribution suggests that when interest rates decline older households experience reduced cash flows, while the disposable incomes of indebted younger households increase.
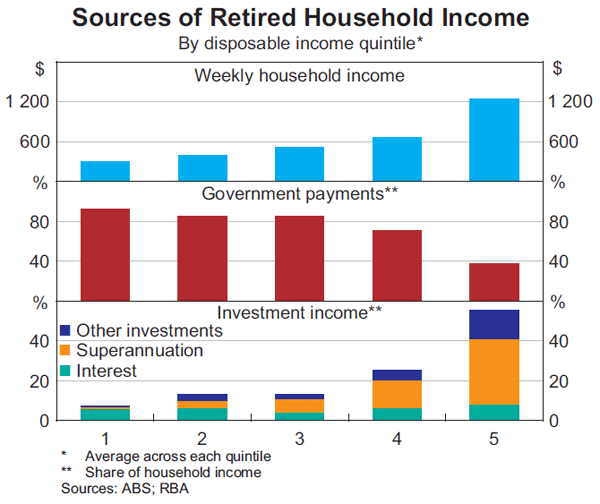
The importance of net interest-bearing assets to the incomes of particular types of households can be examined using the 2009/10 SIH. In general, the results are consistent with the distribution of interest-bearing assets, with direct interest income representing less than 1 per cent of total income for younger households and around 5 per cent for retired households. Within the group of retired households, most households rely on government payments as their primary source of income (Graph 9). However, the quintile of retired households that rely least on government payments – which includes many self-funded retirees – draw more of their income from investments. The largest share of income for this group was derived from superannuation, which would include some indirect interest income, followed by other investments, and direct interest income. The incomes of these households would be the most adversely affected by a decline in interest rates.
Interest Income and Household Spending
The effect of changes in interest rates on household spending via cash flows will partly depend on the extent to which households are liquidity constrained, since households with access to alternative sources of funding may be able to smooth their consumption in response to temporary adverse shocks to income. To analyse this issue, the distribution of household net interest-bearing assets to income can be divided broadly into three groups, those with negative, moderate and high net interest-bearing assets (Graph 10).
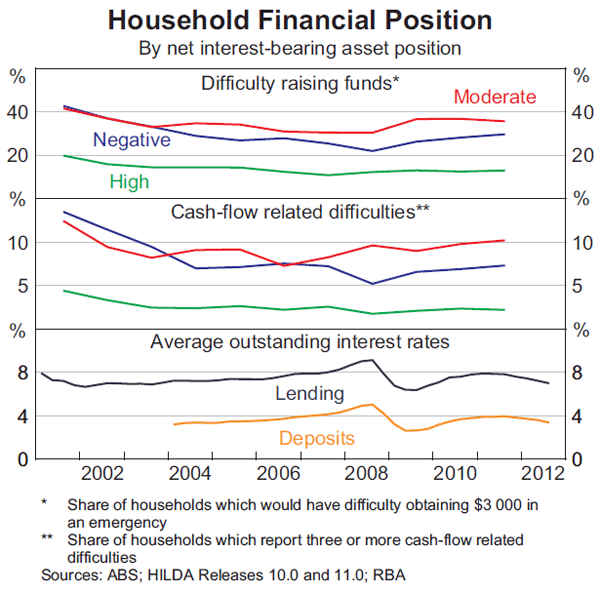
Some evidence for the presence of liquidity constraints is provided by a series of questions in the HILDA survey on whether households have experienced various financial difficulties during the year due to shortages of money (including, for example, difficulties in paying bills, seeking financial help or selling personal possessions), and whether households could quickly raise funds in an emergency. A smaller share of households with high net interest-bearing assets reported such financial and liquidity constraints than those with moderate or negative net interest-bearing assets (Graph 11). This suggests that households with high net interest-bearing assets are less likely to be liquidity constrained when faced with an adverse income shock, such as lower interest rates, and would therefore be less likely to adjust their consumption patterns.
A more rigorous way to establish whether households adjust their spending in response to economic shocks is to directly model household spending. Windsor, Jääskelä and Finlay (forthcoming) construct such a model to estimate the magnitude of housing wealth effects on household spending over the period 2003–2010, exploiting the panel nature of the HILDA survey across the age distribution. They find that younger home owners adjust their spending the most in response to changes in the value of their homes, at around 3 to 4 cents per dollar change in home value. Older households, however, do not experience a significant wealth effect. The authors concluded that the presence of liquidity constraints for younger households was the most likely explanation for these results.
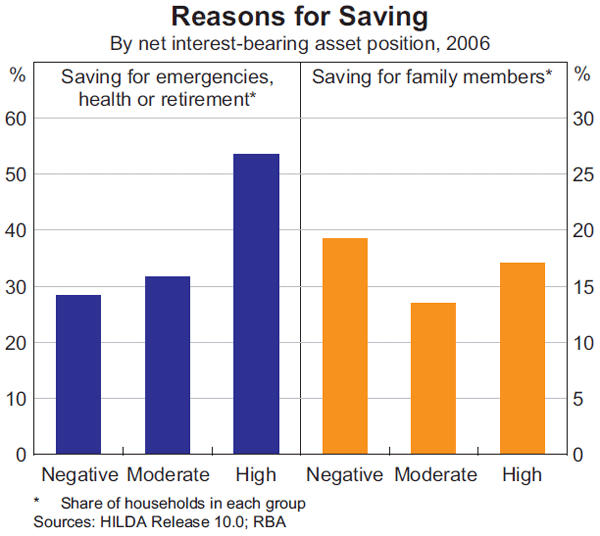
Even though households with high interest-bearing assets may not be liquidity constrained, there may be other reasons why they might reduce their spending in response to lower interest rates. For instance, these households may be preserving their assets as a financial buffer against unanticipated future events, such as medical expenses, or as a bequest. Some evidence for the importance of these saving motives can be observed in the HILDA survey. In 2006, respondents were asked the reasons they save, and in response, over half of households with high interest-bearing assets indicated that they were saving for future emergencies, ill health or old age, which was a much higher share than for other households. In addition, 17 per cent of households with high interest-bearing assets indicated that they were saving to help their relatives or for the education of their children or grandchildren (Graph 12). Given these saving motives, some households with high interest-bearing assets may prefer to reduce their spending in response to lower interest rates rather than deplete their assets.
Conclusion
In aggregate, households invest around two-fifths of their financial assets in interest-bearing assets. Household deposits have grown strongly over recent years, although there has been no growth in interest-bearing securities. Compared with other advanced economies, the share of interest-bearing assets in household financial assets remains low in Australia. In aggregate, household sector debt is larger than interest-bearing assets, so a reduction in interest rates boosts disposable incomes. Looking at the distribution across households, retirees have more interest-bearing assets than younger households, who are more likely to be in debt. The households with debt can be expected to adjust their spending in response to changing interest rates since they are more likely to be liquidity constrained. Even so, households with a large amount of interest-bearing assets may also adjust their spending in response to a change in interest rates, particularly if they hold these assets as a form of ‘self-insurance’ against uncertainty about their future financial situation or plan to leave some of these assets as a bequest. Interest-bearing assets are expected to grow over time as the population ages.
Footnotes
The authors are from Economic Analysis Department. [*]
Of course, changes in interest rates have other important effects which influence household incomes and spending. [1]
For some Australian evidence on the relationship between household debt and financial constraints, see La Cava and Simon (2003). [2]
For more details, see Deans and Stewart (2012). Average term deposit rates in November were around ½ percentage point below their average over the past decade and remained almost 1 percentage point above their lows in 2009. In comparison, the cash rate was 1¾ percentage points below its decade average and ¼ percentage point above its low in 2009. [3]
For instance, see Bean (2012), Bernanke (2012), Miles (2012) and Raskin (2012). [4]
See Lowe (2011) for a more detailed analysis of the rise in household saving. [5]
For further details, see Boge and Wilson (2011) and Heath and Manning (2012). According to the financial accounts, in June 2012 superannuation and other investment funds' bond assets were invested in: foreign bonds (34 per cent); financial corporate bonds (31 per cent); state government bonds (15 per cent); non-financial corporate bonds (12 per cent); and Australian government bonds (8 per cent). These shares have been relatively stable over the past five years. [6]
The household sector has some additional indirect exposure to interest-bearing assets through the insurance industry. Investment income provides an important source of earnings for insurance companies, and around half of their financial assets are invested in interest-bearing assets, particularly in bonds. In the medium term, lower investment income could flow through to higher insurance premiums, which according to the ABS represent around 5 per cent of household spending. [7]
For further detail on the shift in households' appetite for financial risk, see Black, Rogers and Soultanaeva (2012). [8]
The OECD estimate of the share of Australian superannuation funds' assets in interest-bearing assets is likely to be a lower bound, since it does not include interest-bearing assets held on behalf of superannuation funds by life offices (according to the OECD, 15 per cent of superannuation funds' assets were held in life offices in 2011). Even adjusting for this, however, the share of interest-bearing assets would still be low relative to other OECD countries. [9]
For more details on the introduction of compulsory superannuation, see Connolly (2007). The compulsory employer superannuation contribution rate is legislated to increase from 9 per cent of income to 12 per cent between 2013 and 2020. [10]
The distribution of debt is even more highly skewed than the distribution of interest-bearing assets, in part because 31 per cent of households had no debt in 2010; see Finlay (2012). [11]
This is consistent with evidence for the United States in Coile and Milligan (2009). [12]
References
Bean C (2012), ‘Quantitative Easing and the Economic Outlook’, Speech to the Scottish Council for Development and Industry, Glasgow, 21 February. Available at <http://www.bankofengland.co.uk/publications/Documents/speeches/2012/speech546.pdf>.
Bernanke B (2012), ‘Five Questions about the Federal Reserve and Monetary Policy’, Remarks at the Economic Club of Indiana, Indianapolis, 1 October. Available at <http://www.federalreserve.gov/newsevents/speech/bernanke20121001a.pdf>.
Black S, L Rogers and A Soultanaeva (2012), ‘Households' Appetite for Financial Risk’, RBA Bulletin, June, pp 37–42.
Boge M and I Wilson (2011), ‘The Domestic Market for Short-term Debt Securities’, RBA Bulletin, September, pp 39–48.
Coile C and K Milligan (2009), ‘How Portfolios Evolve After Retirement: The Effect of Health Shocks’, Review of Income and Wealth, 55(2), pp 226–248.
Connolly E (2007), ‘The Effect of the Australian Superannuation Guarantee on Household Saving Behaviour’, RBA Research Discussion Paper No 2007-08.
Deans C and C Stewart (2012), ‘Banks' Funding Costs and Lending Rates’, RBA Bulletin, March, pp 37–43.
Finlay R (2012), ‘The Distribution of Household Wealth in Australia: Evidence from the 2010 HILDA Survey’, RBA Bulletin, March, pp 19–27.
Heath A and M Manning (2012), ‘Financial Regulation and Australian Dollar Liquid Assets’, RBA Bulletin, September, pp 43–52.
La Cava G and J Simon (2003), ‘A Tale of Two Surveys: Household Debt and Financial Constraints in Australia’, RBA Research Discussion Paper No 2003-08.
Lowe P (2011), ‘Changing Patterns in Household Saving and Spending’, Speech to the Australian Economic Forum 2011, Sydney, 22 September. Available at <http://www.rba.gov.au/speeches/2011/sp-ag-220911.html>.
Miles D (2012), ‘Asset Prices, Saving and the Wider Effects of Monetary Policy’, Speech at the pro.Manchester Business Conference, Manchester, 1 March. Available at <http://www.bankofengland.co.uk/publications/Documents/ speeches/2012/speech549.pdf>.
Raskin S (2012), ‘Accommodative Monetary Policy and Its Effects on Savers’, Remarks at the Y's Men of Westport, Westport, 1 March. Available at <http://www.federalreserve.gov/newsevents/speech/raskin20120301 a.pdf>.
Super System Review (2009), ‘A Statistical Summary of Self-Managed Superannuation Funds’, Review into the Governance, Efficiency, Structure and Operation of Australia's Superannuation System, 10 December. Available at <http://www.supersystemreview.gov.au/content/downloads/statistical_summary_smsf/SMSF_statistical_summary_report.pdf>.
Windsor C, J Jääskelä and R Finlay (forthcoming), ‘Home Values and Household Spending’, RBA Research Discussion Paper.