Submissions – Financial Sector Submission to the Inquiry into Access of Small Business to Finance
- Download 456KB
Introduction
The submission is in two sections reflecting the Inquiry's terms of reference. The first section summarises recent developments in small business finance. The second discusses the state of competition in small business lending. The main conclusions are as follows:
- Lending to small businesses has been little changed over 2009, after growing steadily over prior years. The slowdown reflects both reduced demand from small businesses and a general tightening in banks’ lending standards. Small businesses in most industries have been able to access funding throughout the financial crisis, albeit on less favourable terms than previously.
- Since late 2008, the interest rates on small business lending have been below their averages over the past decade, as the large net reduction in the cash rate has more than offset the increases in banks’ lending spreads. Fees have risen, but for most businesses they are only a small part of the overall cost of a loan.
- Competition in the small business lending market has eased from the strong levels just prior to the onset of the financial crisis, but should recover as the economy continues to strengthen.
Trends in Intermediated Small Business Finance
Businesses use a combination of debt and equity to fund their operations. Compared with large companies, small businesses tend to make greater use of debt funding and less use of equity funding; the latter is generally limited to the personal capital of the owners. Small businesses rely mainly on loans from banks and other financial institutions for their debt funding, as it is difficult and costly for them to raise funds directly from debt capital markets.
It is not possible to directly identify loans to small businesses from available data. However, it is possible to make an assessment based on the size of loans, assuming that loans of less than $2 million are generally provided to small businesses while loans greater than $2 million are generally financing larger businesses. In December 2009, loans smaller than $2 million amounted to around $200 billion, about 30 per cent of total business lending by banks. An alternative measure of small business finance is lending to unincorporated enterprises. Both of these measures are shown in Graph 1 which suggests that lending to small businesses by banks was little changed during 2009, after growing steadily during the prior few years.
In contrast, borrowing by large business has fallen as these businesses have raised new equity capital to repay debt and strengthen their balance sheets and scaled back their debt-funded acquisitions.[1] Banks have also tightened their lending standards for large businesses (as they have for smaller businesses ’ see below).
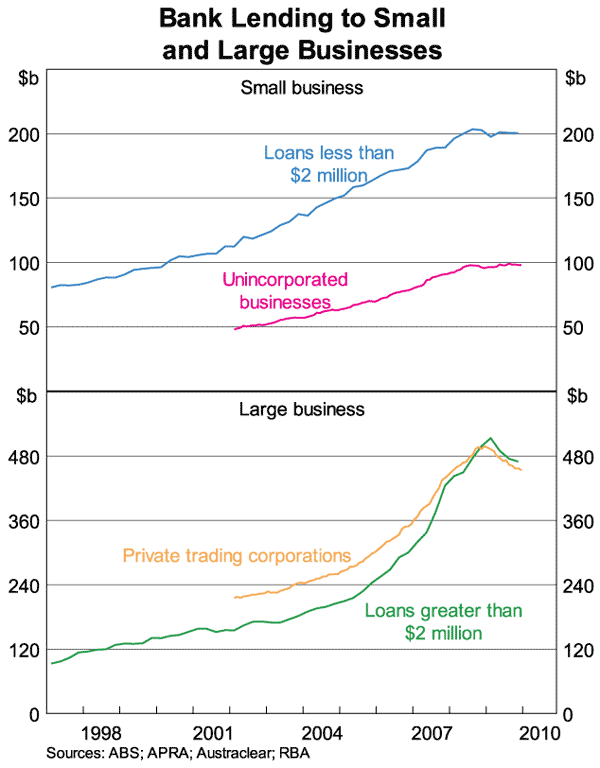
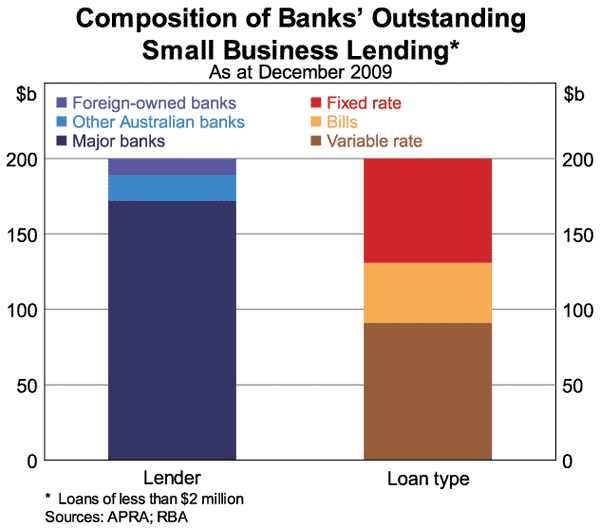
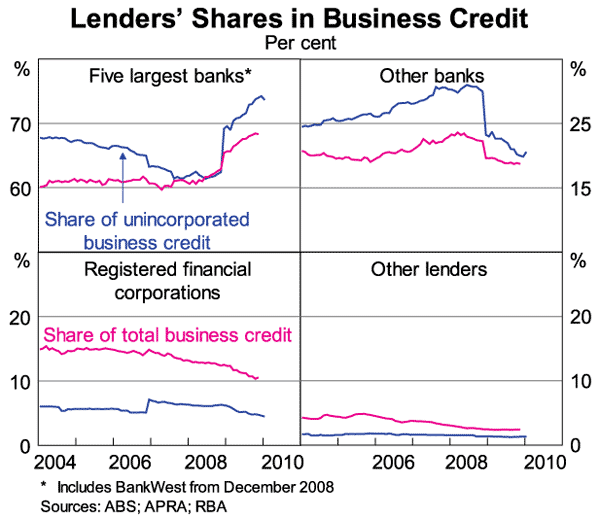
The major banks are a particularly important source of debt funding for small businesses. In December 2009, they accounted for about 85 per cent of the total value of business loans smaller than $2 million, compared with 75 per cent of larger loans (Graph 2). The smaller Australian banks account for most of the remaining lending to small businesses. Foreign-owned banks provide only a small share, in part because they do not have a substantial branch network. Over recent years, the smaller Australian banks and foreign-owned banks have ceded some market share to the major banks (see section on Competition in Small Business Lending below).
About two-thirds of lending to small businesses is through commercial bills and other loans with variable interest rates. The remaining third of lending is at fixed rates; the interest rates on these loans are generally fixed for between one and five years.
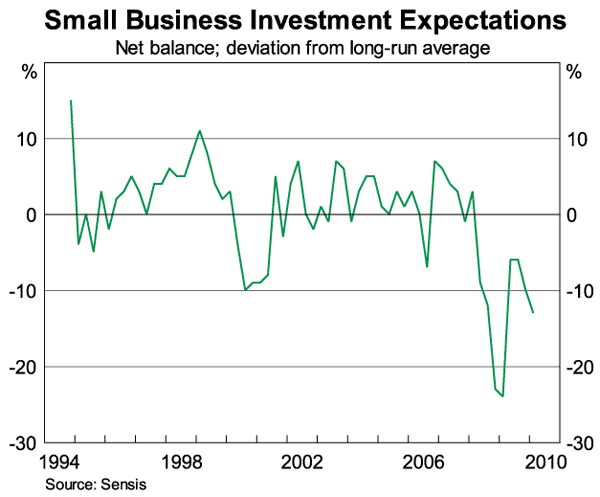
The recent slowdown in small business credit growth reflects both demand and supply factors. Small businesses’ demand for debt funding fell as the increased uncertainty about the economic outlook led them to scale back their capital expenditure plans and focus on reducing their existing debt (Graph 3). On the supply side, financial intermediaries tightened their lending standards during the recent economic slowdown, as their non-performing assets rose. Small business borrowers have faced lower loan-to-valuation ratios, stricter collateral requirements and higher interest coverage ratios.
Small business surveys provide mixed evidence on the availability of finance. Some business surveys, such as the PwC/East & Partners Business Barometer and the ACCI Small Business Survey, suggest that over the past year the availability and cost of intermediated debt has been a constraint on small businesses. However, others, such as the Sensis Business Index and the NAB SME Survey suggest that the cost and availability of debt financing is a concern for relatively few small businesses, with issues such as lack of sales, future cash flow and the economic climate being more important.[2]
In aggregate, the available data and liaison by the Reserve Bank, including through its Small Business Panel,[3] suggest that small businesses in most industries have had tighter but still reasonable access to funds throughout the financial crisis, with property companies being a notable exception.
Interest rates
In setting their interest rates on small business loans (as well as loans to large businesses and households), banks take into account changes in their funding costs and also perceived changes in the riskiness of the borrower.
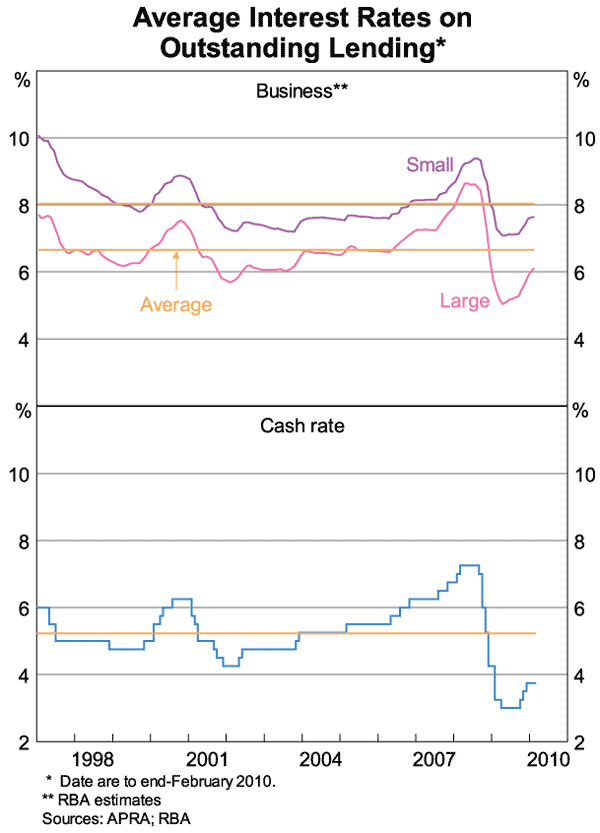
Most lending to small businesses is secured against residential property, and over the past few years the banks’ indicator rates have been representative of the actual rates paid by most small business borrowers.[4] The interest rates on residentially secured, small business loans are currently about 80 basis points above those on prime, low doc housing loans. This compares with a differential of just 30 basis points in mid 2007 and about 50 basis points earlier in the decade. The recent widening in this differential is related to the higher arrears on small business lending, though as the Australian economy strengthens, there may be some incentive for new or existing lenders to expand their lending in this sector and compete away some of this spread.
From the late 1990s until 2007, banks’ adjusted their small business indicator rates mainly in response to changes in the cash rate. As the financial crisis unfolded and banks’ funding costs increased, all lending rates have risen relative to the cash rate. The higher costs of deposits and long-term wholesale debt, together with changes in banks’ funding mix, have increased banks’ overall funding costs significantly.[5]
Reflecting this, the major banks’ average variable indicator rate for residentially-secured term loans has risen by about 200 basis points relative to the cash rate since mid 2007 (Graph 4).[6] This is larger than the rise of 110 basis points in the housing loan indicator rate but is similar to the increase in the average large business borrowing rate. The greater increase in business rates than housing rates in large part reflects a reassessment of risk margins on business lending in light of the difficult economic and financial conditions of the past couple of years.
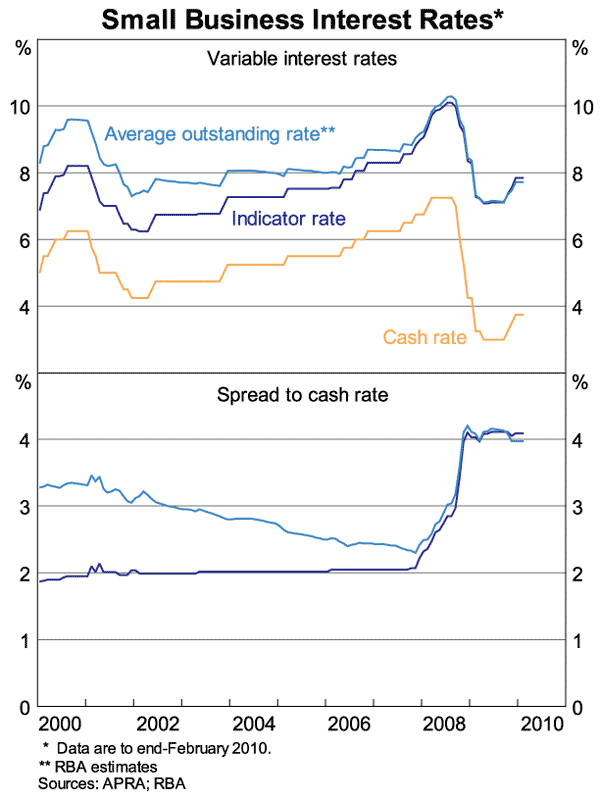
Notwithstanding the increase in risk margins, the average rate on outstanding small business loans (including variable-rate and fixed-rate) has fallen by about 170 percentage points from its peak in mid 2008, reflecting the large net reduction in the cash rate since then (Graph 5). It remains about 40 basis points below its post 1997 average.
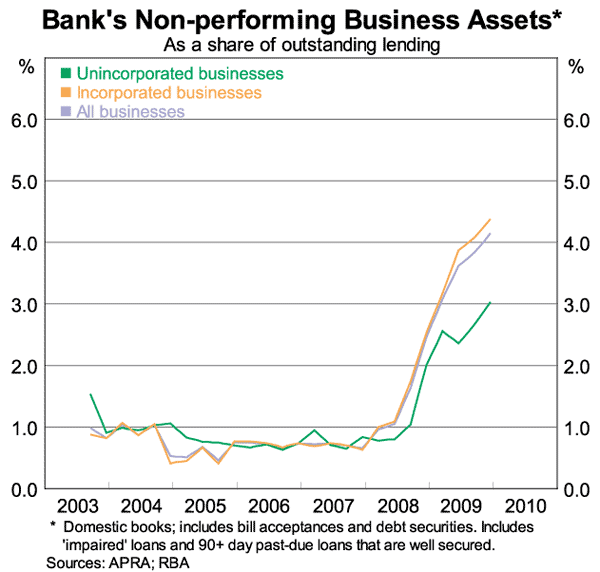
Non-performing business loans (that is loans that are impaired, or more than 90 days in arrears but well secured) comprised around 4 per cent of banks’ total business loans in December 2009, up from a little under 1 per cent during 2005–2007 (Graph 6). The deterioration over the past two years has been somewhat less for small unincorporated enterprises than for larger corporates.
Fees
The RBA Bank Fees Survey shows that in the 2008 financial year, banks’ fee income from businesses (both small and large) amounted to $6.7 billion.[7] Lending fees ’ those on loans and bank bill facilities ’ accounted for about half of total fees on businesses, with merchant service fees and fees on deposit accounts accounting for most of the remainder.
Lending fees increased at an average annual rate of 7 per cent during 2000–2008, slower than the rate of growth in banks’ business lending over this period. During the 2009 financial year, banks’ fees appear to have risen more quickly than in previous years. Liaison suggests that the faster growth is mainly due to a greater incidence of existing fees, owing in particular to the reduced availability of fee waivers. However, fees are only a small part of the overall cost of a loan for most businesses. In 2008, lending fees were equivalent to about 50 basis points on the stock of banks’ outstanding business lending, less than one-tenth of the average interest rate paid on outstanding business loans.
Competition in Small Business Lending
Since the onset of the crisis, competition in lending has decreased. The easing in competition is to some extent cyclical. During periods of strong economic growth, banks tend to compete aggressively for business lending by cutting their margins and relaxing their lending standards. However, when the economic and business outlook is uncertain and loan losses are rising, as has been the case over the past couple of years, banks see the loans as being more risky and pull back a little.
Reduced lending by the smaller banks and the non-bank financial institutions appears to have been the main factor in the easing in competition in the recent cycle (Graph 7). The major banks have increased their market share, partly through acquisition, and now account for about three-quarters of lending to unincorporated businesses, and about two-thirds of total business credit.
As the economy strengthens, competition for business lending is likely to pick up; there are already some signs of this in the Reserve Bank's liaison with medium and large sized businesses. Finally, increased lending by foreign-owned banks also should occur as global conditions continue to improve.
Endnotes
See Black S, J Kirkwood and S Shah Idil (2009), ‘Australian Corporates’ Sources and Uses of Funds’, RBA Bulletin, October, pp 1–12. [1]
The PwC/East & Partners Private Business Barometer surveys around 758 private businesses with annual turnover between $10 million and $100 million; 60 per cent of companies have fewer than 100 employees. The Sensis Business Index covers approximately 1,400 small businesses and 400 medium businesses (20 to 199 employees). The NAB SME survey includes about 700 firms with annual turnover between $2 million and $10 million. The ACCI Small Business Survey covers small (fewer than 20 employees), medium (20 to 99 employees) and large business (100 or more employees). The survey generally includes 1,000 to 2,000 firms. [2]
The Small Business Panel is a group of small business operators from around Australia that the Reserve Bank convenes to discuss finance conditions in the small business sector. [3]
In 2000, actual rates were about 1½ percentage points above the residentially secured indicator rate. This gap narrowed significantly during the first half of this decade, reflecting the strong competition between lenders and an increase in the use of residential property as collateral. [4]
See Brown A, Davies M, Fabbro D and Hanrick T (2010), ‘Recent Developments in Banks’ Funding Costs and Lending Rates’, RBA Bulletin, March, pp 35–44. [5]
Indicator rates on new 3-year fixed rate small business loans have risen by about 140 basis points relative to the yields on Government bonds with equivalent duration. [6]
See McLachlan R and M Wright (2009), ‘Banking Fees in Australia’, RBA Bulletin, May, pp 11–15. [7]