Submissions – Economic Activity Submission to the Inquiry into the Prudential Regulation of Investment in Australia's Export Industries
Joint Standing Committee on Trade and Investment Growth
- Download 630KB
The Reserve Bank has been invited to make a submission to this inquiry. The Reserve Bank recognises the key contribution of Australia's export industries to economic activity and employment, particularly in rural and regional areas.
The Reserve Bank does not have responsibility for prudential policy or guidance, which lies with APRA. However, the Reserve Bank does have a mandate for the stability of the financial system. In that context, the Reserve Bank has stated that banks and other financial institutions take appropriate account of risk in their lending and investment decisions. That applies to investing in, or lending to, companies in the export sector, as it also does to companies in other parts of the Australian economy.
The remainder of the submission provides an overview of Australia's exports across a number of dimensions.
Overview of Australia's exports
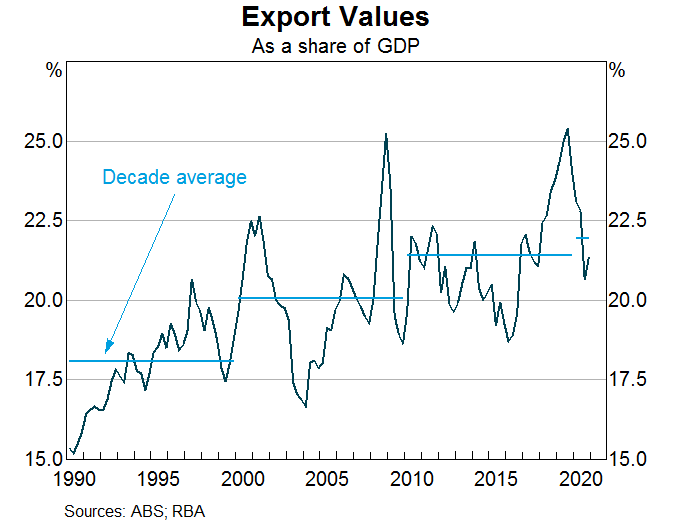
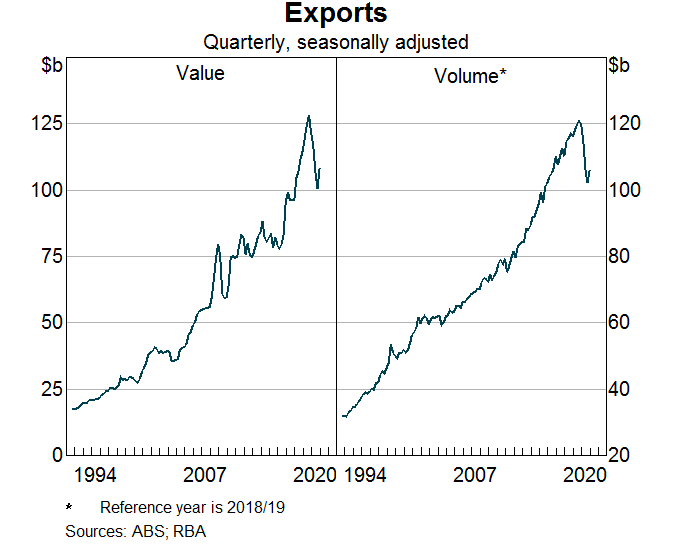
The total value of Australia's exports was $108 billion in the December quarter 2020, accounting for around 21 per cent of GDP. This compares with $121 billion, or 24 per cent of GDP, a year earlier and an average of 18 per cent of GDP in the 1990s.
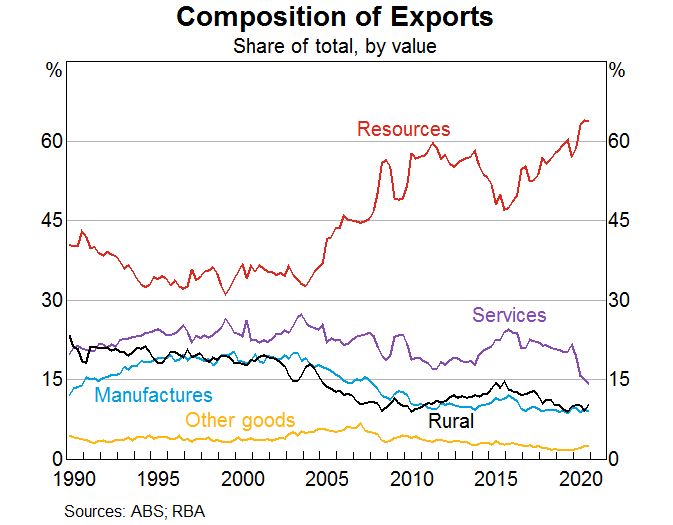
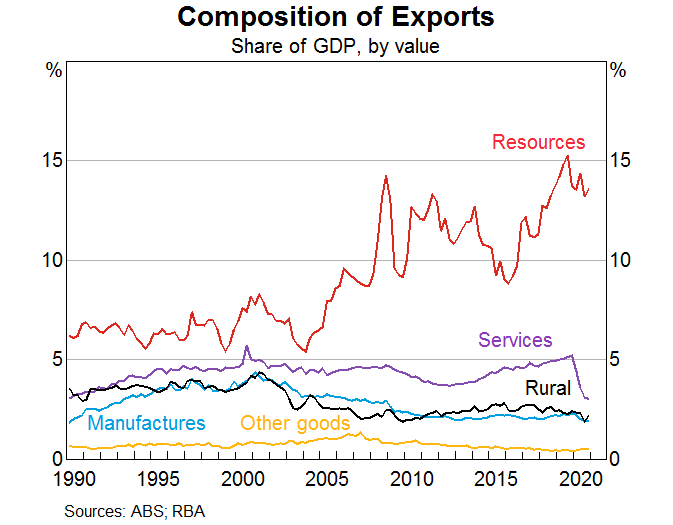
Resource exports make up the largest share of Australia's exports, recently accounting for over 60 per cent of exports, followed by services exports.
Exports by component
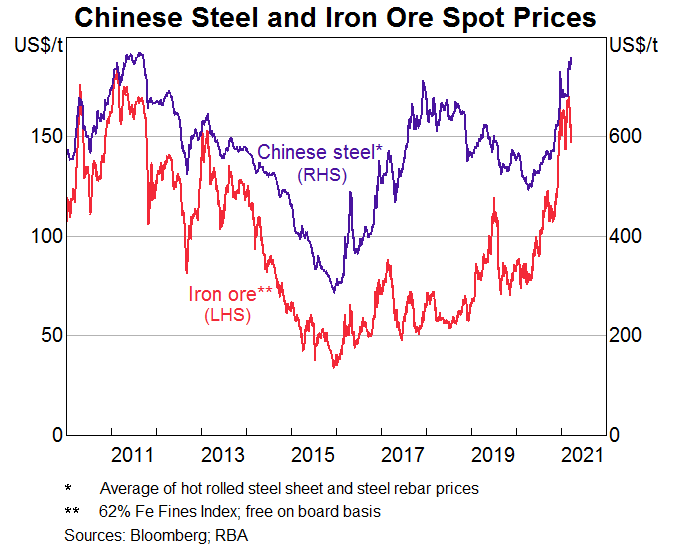
Growth in resource exports, in both value and volume terms, have been led by iron ore exports. Robust demand from Chinese steel producers and supply disruptions in Brazil have supported high prices and export volumes over 2020 and the start of 2021.
LNG export volumes increased over the second half of 2020 and early 2021, driven by increased global energy demand as the northern hemisphere winter was colder than expected.
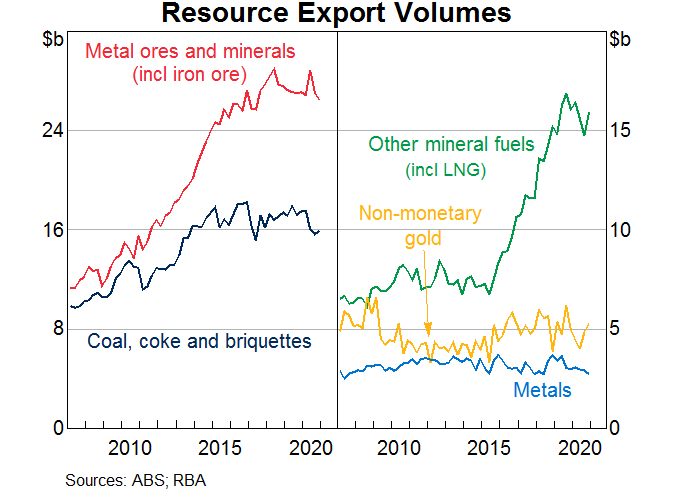
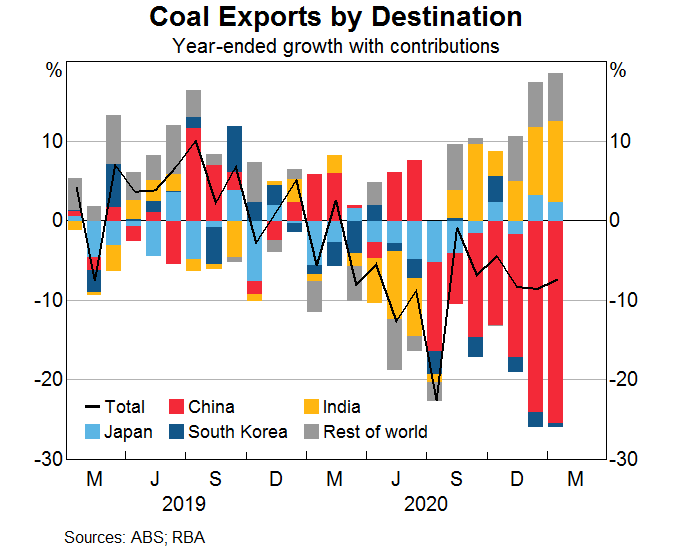
Coal export volumes declined a little over the second half of 2020 and early 2021, driven by weaker global demand for coal. Coking and thermal exports to China have declined markedly recently and reached zero in January 2021. The fall in coal exports to China has been partly (but not fully) offset by increased exports to other countries, including India and Japan.
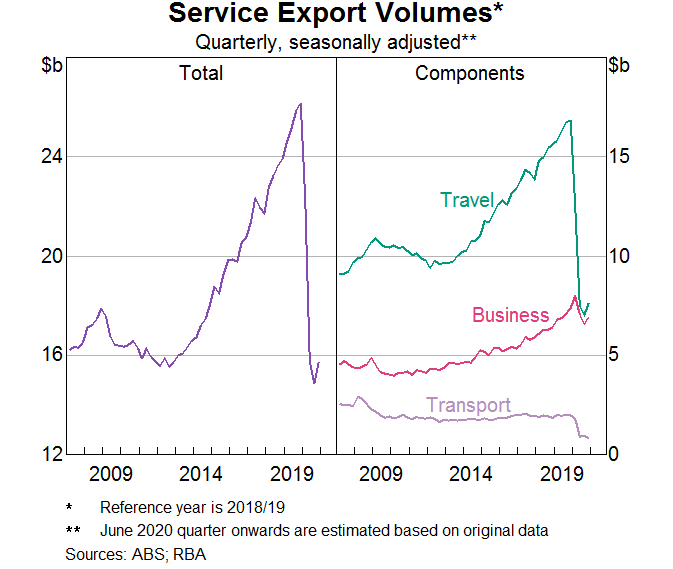
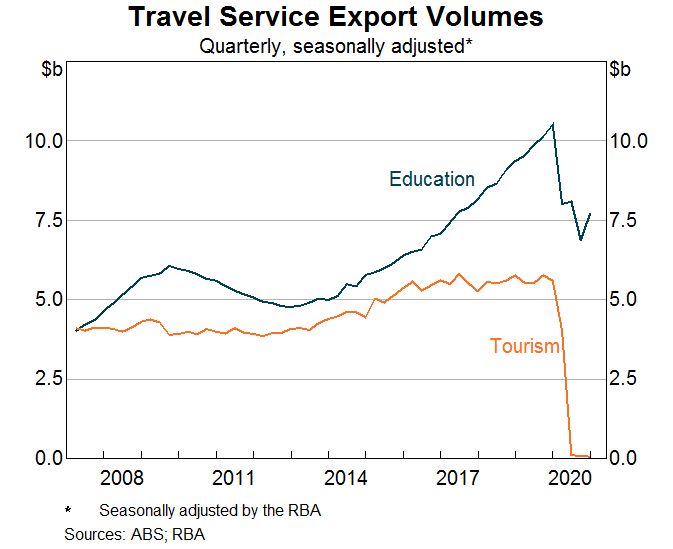
Services export volumes have fallen by around 40 per cent since the start of the pandemic, driven by a sharp fall in travel services as international border closures restricted travel. Tourism exports were near zero in the first half of 2020. Education exports also fell notably, as student enrolments declined and the share of students undertaking remote learning increased, which reduces the amount of export revenue in the form of students' spending on such things as living expenses while in Australia.
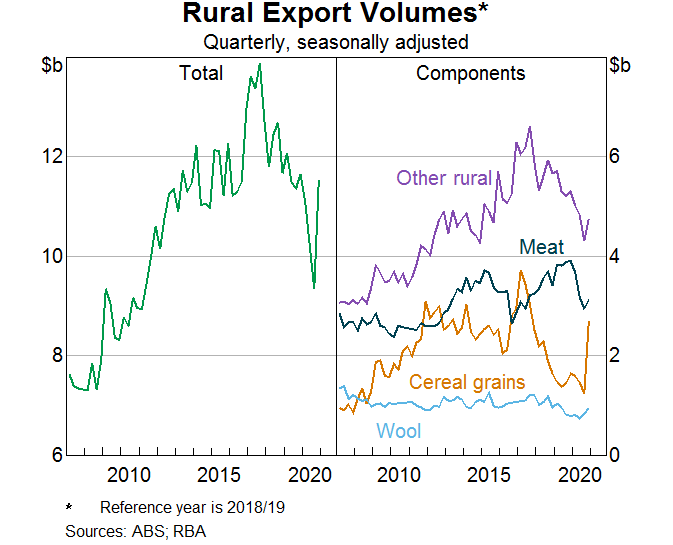
Rural exports fell over most of 2020, driven by lower livestock-related exports as producers rebuilt their herds after the drought broke in parts of Australia last year. Rural exports began to recover at the end of the year as favourable domestic weather conditions supported record local harvests and strong wheat exports.
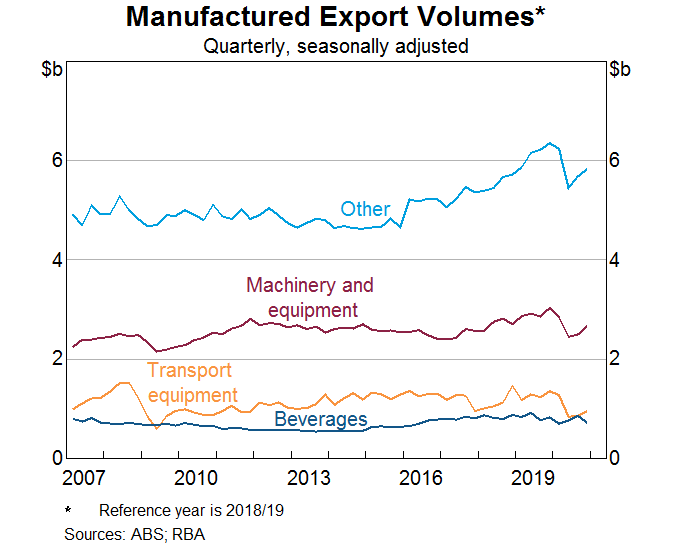
Manufactured exports fell during the onset of the pandemic but have started to recover, led by machinery & equipment and other manufactured goods.
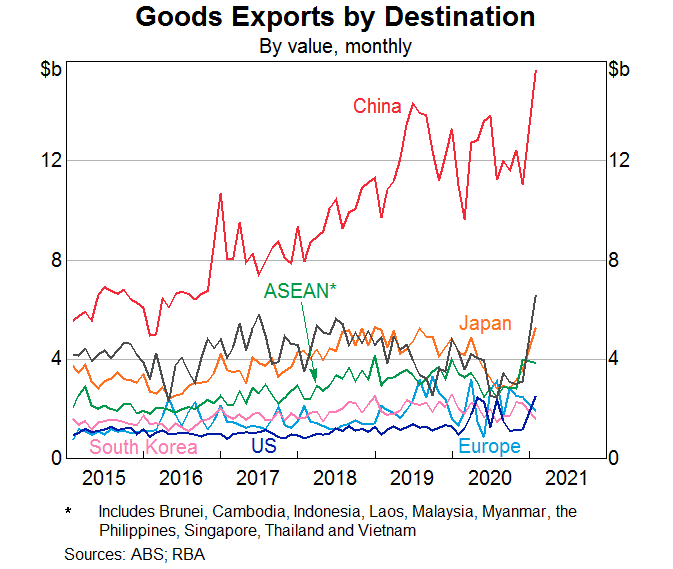
Exports by destination
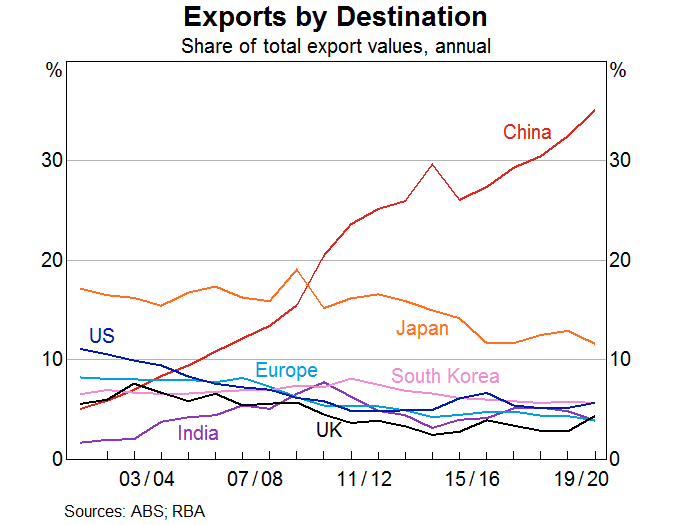
China is Australia's largest trading partner, making up over one-third of our total goods and services exports in 2019/20, followed by Japan and other economies in Asia.
Goods exports to China increased significantly over December 2020 and January 2021 as reduced coal exports to China were more than offset in aggregate by a large increase in exports of iron ore.
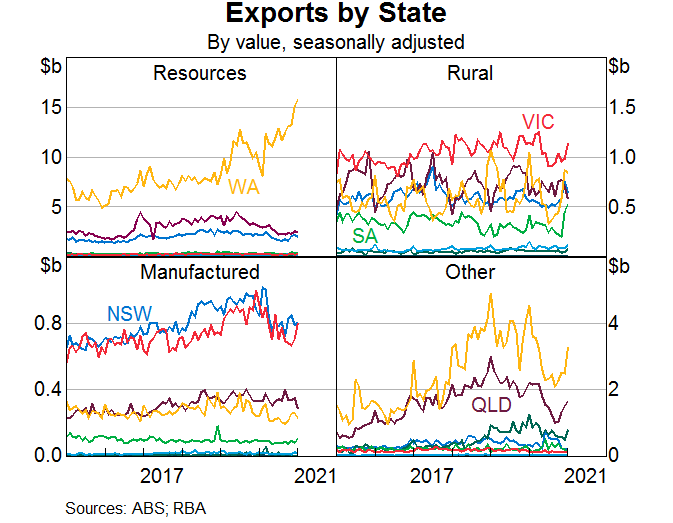
Exports by state
The graph below shows the amount of each broad category of exports coming from each state. Note that the scales in each panel of the graph vary considerably by export category.
Reserve Bank of Australia
23 March 2021