Weights for the TWI
New weights for the trade-weighted index (TWI) of the Australian dollar have been compiled by the Reserve Bank. The weights are based on trade data for the 2010/11 financial year and will apply from 1 December 2011. The new index includes the same 21 currencies as the previous index, with these currencies accounting for just over 90 per cent of Australia's total merchandise and services trade in 2010/11. As previously notified, the new weights incorporate a change in methodology and will now be based on both merchandise and services trade, rather than merchandise trade only (see Notification of Changes). In general, the inclusion of services trade acts to reduce the weights on Asian currencies and increase the weights on North Atlantic currencies; however, the overall effect on the published TWI is small. For most currencies, the combined effect of updating the merchandise trade weights and adding services trade to the calculations is relatively modest. As a result, the ranking of the top five currencies is unchanged from last year (Table 1).
| Trade weight* | ||
|---|---|---|
| Currency | From 1 December 2011 (Merchandise and services) |
1 October 2010 – 30 November 2011 (Merchandise only) |
| Chinese renminbi | 22.5803 | 22.5371 |
| Japanese yen | 13.5025 | 14.9356 |
| European euro | 9.6731 | 9.9174 |
| United States dollar | 9.5351 | 8.5423 |
| South Korean won | 6.3500 | 6.4074 |
| Singapore dollar | 4.6714 | 4.3425 |
| United Kingdom pound sterling | 4.2808 | 3.5337 |
| New Zealand dollar | 4.2091 | 4.0894 |
| Indian rupee | 4.1947 | 4.9052 |
| Thai baht | 3.8040 | 4.6668 |
| Malaysian ringgit | 3.1463 | 3.1598 |
| Indonesian rupiah | 2.7554 | 2.4527 |
| New Taiwan dollar | 2.6874 | 2.7943 |
| Hong Kong dollar | 1.6188 | 1.0461 |
| Papua New Guinea kina | 1.3897 | 1.3340 |
| Vietnamese dong | 1.2197 | 1.2292 |
| United Arab Emirates dirham | 1.0614 | 1.1617 |
| Swiss franc | 1.0434 | 0.6820 |
| Canadian dollar | 0.9386 | 0.8213 |
| South African rand | 0.6818 | 0.7530 |
| Swedish krona | 0.6565 | 0.6885 |
|
* Weights are re-scaled to sum to 100 Sources: ABS; RBA |
||
The combination of changing the methodology and updating the merchandise trade data has resulted in the weight on the Chinese renminbi remaining broadly unchanged, and still the highest in the index. The Japanese yen is again ranked second, although its weight decreased by 1.4 percentage points from last year. The weights on the US dollar and the UK pound sterling rose by 1.0 and 0.7 percentage points respectively, while the weight on the euro fell slightly from last year.
The Impact of Including Services Trade on the Current Year's Currency Weights
The change in the methodology results in the TWI weights being based on a more comprehensive measure of Australia's trade, taking advantage of the additional information provided by the country-level services trade data that have been published by the Australian Bureau of Statistics (ABS) over recent years. Otherwise, the methodology is unchanged. See ‘TWI – Method of Calculation’ for a description of the methodology for constructing the TWI.
Services trade has accounted for a relatively stable 20 per cent share of Australia's total trade over the past 40 years. However, there are some important differences in the country composition of merchandise and services trade (Graph 1). In particular, while the share of both merchandise and services trade with emerging market economies (in particular, China) has risen over time, services trade is still dominated by trade with the US and Europe.
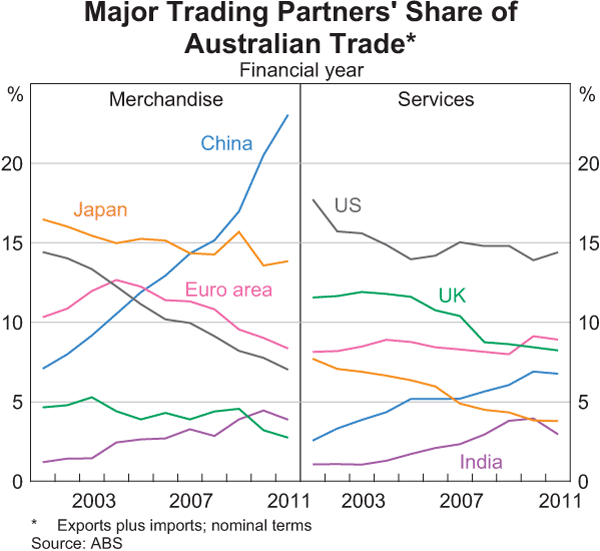
The inclusion of services trade therefore has a sizeable effect on some currency weights – in some cases, as much as 2–3 percentage points (Table 2). In particular, it increases the weights on the US dollar and the UK pound, and reduces the weights on the Chinese renminbi and the Japanese yen. For 14 of the 21 currencies in the TWI, the inclusion of services trade offsets the effect of updating the merchandise trade weights. As a result, the overall changes in the TWI weights for individual currencies are, on average, slightly smaller than in previous years.
| Change due to inclusion of services trade | Change due to merchandise trade update | Total change in weights* | |
|---|---|---|---|
| Chinese renminbi | −2.9 | 2.9 | 0.0 |
| Japanese yen | −1.8 | 0.4 | −1.4 |
| European euro | 0.4 | −0.7 | −0.2 |
| United States dollar | 1.8 | −0.8 | 1.0 |
| South Korean won | −0.8 | 0.7 | −0.1 |
| Singapore dollar | 0.6 | −0.3 | 0.3 |
| United Kingdom pound sterling | 1.3 | −0.5 | 0.7 |
| New Zealand dollar | 0.6 | −0.5 | 0.1 |
| Indian rupee | −0.1 | −0.6 | −0.7 |
| Thai baht | −0.1 | −0.8 | −0.9 |
| Malaysian ringgit | 0.0 | −0.1 | 0.0 |
| Indonesian rupiah | 0.2 | 0.1 | 0.3 |
| New Taiwan dollar | −0.4 | 0.3 | −0.1 |
| Hong Kong dollar | 0.6 | 0.0 | 0.6 |
| Papua New Guinea kina | 0.0 | 0.0 | 0.1 |
| Vietnamese dong | 0.1 | −0.2 | 0.0 |
| United Arab Emirates dirham | −0.2 | 0.1 | −0.1 |
| Swiss franc | 0.3 | 0.0 | 0.4 |
| Canadian dollar | 0.2 | −0.1 | 0.1 |
| South African rand | 0.1 | −0.1 | −0.1 |
| Swedish krona | 0.0 | 0.0 | 0.0 |
|
* Changes may not reconcile due to rounding Sources: ABS; RBA |
|||
The Impact of Including Services Trade on Previous Years' Currency Weights
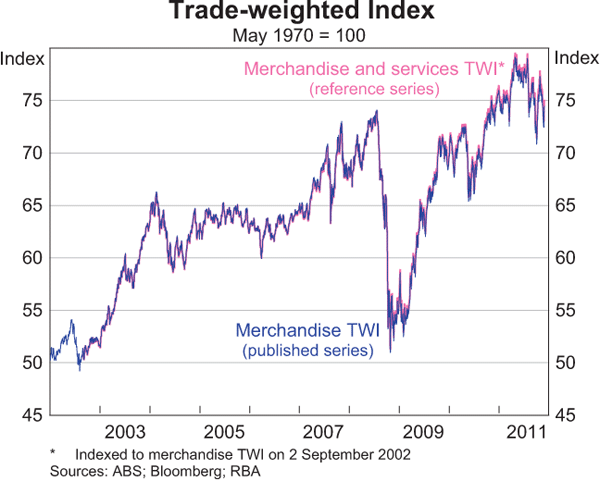
The overall effect of the methodological change on the published TWI is not large. Although the published TWI data will not be revised, a reference series has been constructed for comparison purposes using historical merchandise and services trade weights (Graph 2). Comparing this reference series to the published series since 2002 illustrates that had services trade been included previously, it would have only had a negligible effect on the historical Australian dollar TWI series. This is consistent with previous work.[1] This reflects two factors: first, that the weights have tended to shift between countries whose currencies have moved closely together; and second, that the Australian dollar typically moves in the same direction against most other currencies.
Footnote
See for example Kim Edwards, Dan Fabbro, Mark Knezevic and Michael Plumb (2008), ‘An Augmented Trade-weighted Index of the Australian Dollar’, RBA Bulletin, February. [1]