RDP 2004-08: Housing Construction Cycles and Interest Rates 4. Empirical Estimates
October 2004
- Download the Paper 186KB
Egebo et al (1990) surveyed earlier literature and macroeconometric models estimating housing construction. Many of these models specified demand as a stock and supply as a flow, while those designed for forecasting tended to include a stock-adjustment component, with less emphasis on fundamental demand factors. Our focus here is on disentangling supply and demand with a view to understanding cross-country differences, rather than on forecasting performance.
4.1 Data
Limitations on data availability confine our econometric modelling to four countries – Australia, Canada, the United States and the United Kingdom. The models of demand and supply developed in the previous section involve two measures of quantity – number and total investment (number times quality) – and two prices: the structure price and the total price including land. For quantities, we use housing starts from building activity surveys and housing construction investment from the national accounts. The deflator for housing construction is used as the measure of structure prices. Total housing prices are represented as median sale prices of established dwellings; these can be obtained from lenders, real estate associations or statistical agencies, depending on the country. The structure price measure captures the cost of a constant volume of construction, but the average or median house price does not generally incorporate an effective quality adjustment. Thus there might be a wedge between these two price measures beyond that caused by land prices, which would introduce a distortion into our econometric results.
Permanent income is proxied by the sum of non-durables and services consumption, except for the UK, where total consumption is used. We used materials and labour costs series specific to the construction industry to capture construction costs, except for Canada where only economy-wide materials price indices were available. We use the policy interest rate, not the mortgage rate, to ensure that we are comparing the effects of the same kinds of shocks to interest rates across countries. This may reduce the models' fit if mortgage rates key off long rates as in the US, or if interest margins have varied over time, as in Australia. On the other hand, it means we do not need to model pass-through of policy rates to mortgage rates separately.
As shown in Equation (3), our preferred theoretical model of demand for the number of dwellings is driven by the number of households in the long run. Our quarterly series for the UK, the US and Canada are interpolations of annual data, while for Australia, we estimate the number of households using an estimated household formation rate and population data. These smoothed data series avoid the effects of short-run endogeneity in the household formation decision.
Demand for and supply of public housing presumably respond to different forces than the market-oriented forces considered here. However, public housing clearly satisfies the flow (consumption) demand of some households. If the share of public housing changes over time, as has been true in the UK (Attanasio and Weber 1994), time-series estimates for demand for privately owned housing would be distorted by the exclusion of public housing. Thus it would be preferable to consider all dwellings in our estimates, accounting for the differing influences of the public and private sectors. However, because of data constraints in the other three countries, we are only able to include public dwelling construction in the UK, though it is arguably most important there. Further details on the data are contained in Appendix A.
4.2 Preferred Specification
We have four endogenous variables – two different prices, plus quantity and quality of new housing – and four equations determining them in the form of supply and demand equations for both quantity and quality. Many of the explanators are clearly endogenous and likely to be correlated with the equations' error terms.[5] The error terms are likely to be correlated across equations as well, given the tight relationship between variables such as housing starts (quantity) and dwelling investment (quantity multiplied by quality). Therefore we used the three-stage least squares instrumental variables estimator to avoid statistical problems involved with using endogenous explanators. All current-dated variables are treated as potentially endogenous, while all lag-dated variables are taken to be potential instruments. We followed a general-to-specific methodology to arrive at a preferred dynamic specification, but by default we retained variables as instruments that had been dropped from the second-stage estimates of the behavioural equations. This helped avoid serial correlation in the residuals, which would have resulted in inconsistent parameter estimates. Serial correlation would have been especially problematic in an instrumental variables estimate, because the lagged variables used as instruments would also be correlated with the errors.
To obtain sensible results, we also made several modifications to the specifications set out in Section 3. As highlighted earlier, we imposed the restriction, in Equation (4) for house prices, that the coefficients on the lagged house price and the general price level be of equal and opposite sign. In the short-run dynamics, we allowed some departure from this by including house price inflation and CPI inflation separately. For Canada and the UK, the relative price of housing is the only long-run determinant of house prices. For Australia, the aggregate level of income is also important in the long run, while in the US, average household income matters.[6] Similarly, we allowed for incomplete short-run arbitrage between house-and-land packages and empty blocks of land by including the total price of housing in the structure price equation. This was an important modification; it seems that builders/developers do have scope to set total prices, as in all cases structure prices depend positively on house (and thus implicitly land) prices.
Following Tsatsaronis and Zhu (2004), we also allowed for mortgage tilt and other financial frictions to affect housing demand by including nominal interest rates as an explanator. Because the inflation rate is already in the short-run dynamics to capture the effects of relative housing prices discussed above, including both nominal and real interest rates directly would introduce excessive collinearity. Therefore we included nominal rates on their own and allowed the coefficient on inflation to mop up both the effect of real interest rates and of relative house price inflation. The risk in this approach is that the coefficient on inflation might also be picking up trends that the cointegrating relationships are not adequately capturing; in some cases these were quite imprecisely estimated. Nominal interest rates fell substantially in the countries studied, in line with the disinflations of the 1980s and early 1990s.
Finally, we allowed for structural change, mainly in the short-run dynamics of the models, to capture the effects of financial deregulation, and of the introduction of Goods and Services Taxes (GST) in Australia and Canada. In line with the results in Aoki et al (2002) and McCarthy and Peach (2002), we find significant structural instability in the United States and the United Kingdom. In both countries, Chow tests suggest there is a break around the beginning of 1986, consistent with the timing of financial deregulation.[7] Although there was some weak evidence of structural instability in the Australian model, we found that the model fit the data better without it. There was no evidence of structural instability in the model for Canada. This is consistent with the lack of a clear episode of financial deregulation in the sample period, since the mortgage market in Canada was already quite lightly regulated as early as the 1960s (Edey and Hviding 1995).
The introduction of a GST permanently shifts the level of structure prices. This is captured as a permanent shift dummy in the post-introduction period, although the effect was not significant for Canada. We also included a dummy in the quarter of introduction to account for the one-off increase in the growth rate of prices. Prices were higher and production lower after the GST's introduction in both countries. We also found evidence of a significant ‘bring-forward’ effect in Australia – but not Canada – in the quarters immediately preceding the GST's introduction. Demand was temporarily higher as households brought their construction plans ahead of the GST's start date. Supply was also temporarily higher to take advantage of this temporary surge in demand; for example, construction firms were observed to be working unusually high levels of overtime in the period prior to the GST's introduction in Australia.
4.3 Results
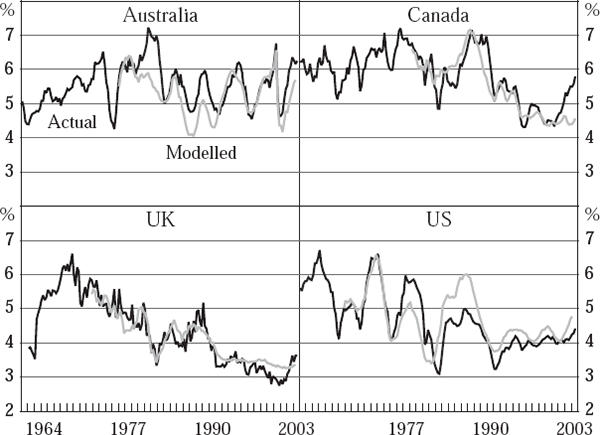
The models presented in Appendix B match the data reasonably well, but plots indicate that the fitted values for housing construction tend to undershoot the actual series for Australia, Canada and the UK in the last couple of years in the sample (Figure 4). It seems likely that some other omitted factor affected outcomes over this period; it may be that households have been spending on housing out of transitory as well as permanent income. Another possibility is that the different treatment of changes in average housing quality in the two price series is hampering separate identification of supply and demand. In any case, the (demand) equation for house prices is not particularly precisely estimated for any of the countries, although in this respect our results compare fairly well with previous literature. Some models of housing prices alone (Bourassa and Hendershott 1995; Abraham and Hendershott 1996, for example) incorporate ‘bubble’ components, implying extrapolative expectations, to account for movements in housing prices that cannot be explained by macroeconomic fundamentals. It may be that our models are not properly capturing such a phenomenon, even though the equations for housing prices already include lagged price growth terms as explanators.
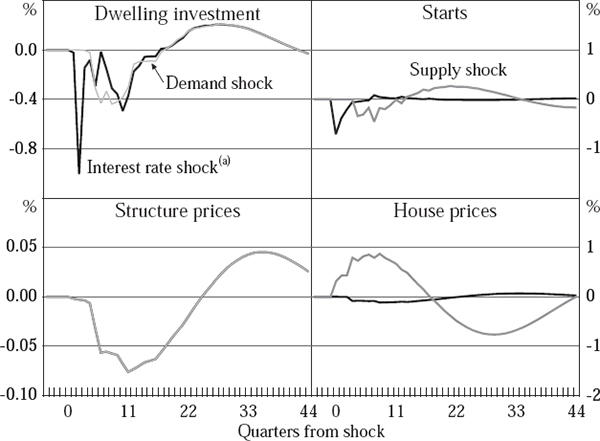
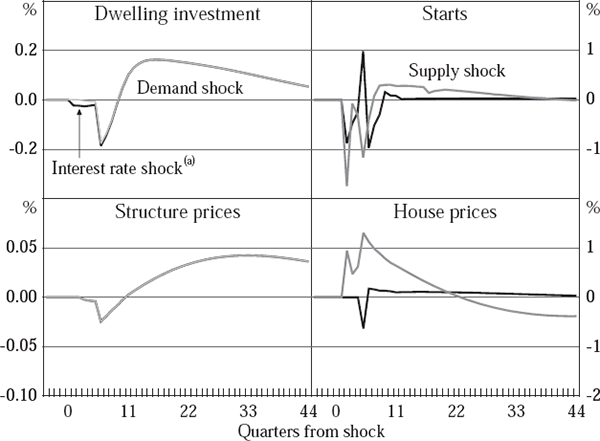
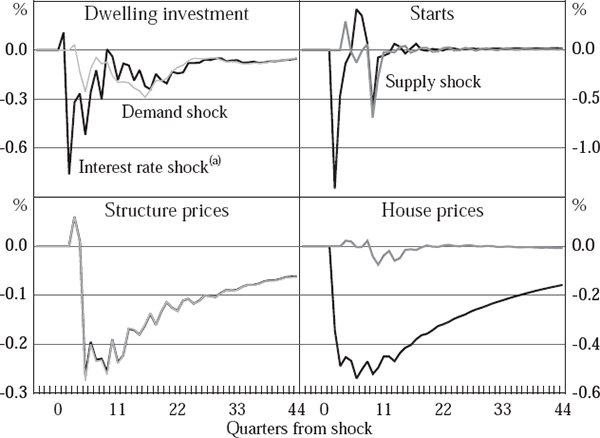
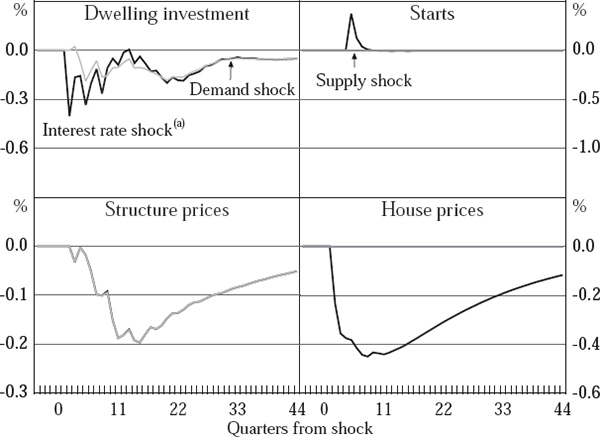
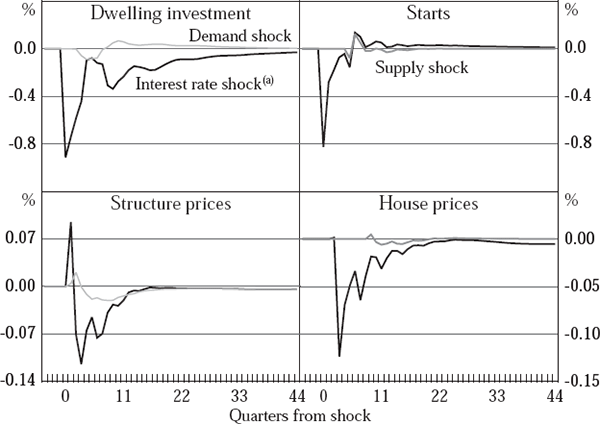
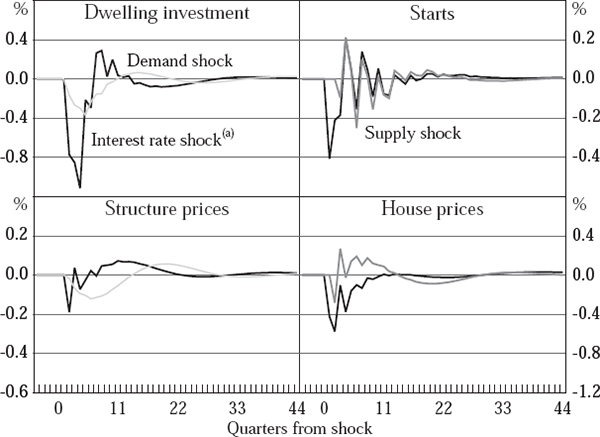
It is difficult to infer much about the behaviour of the housing sector from the raw econometric results, so we explore them using impulse responses. First, we investigate own-price elasticities by subjecting the supply equations to a demand shock (grey lines in the left-hand panels of Figures 5 to 10) and the demand equations to a supply shock (grey lines in the right-hand panels). The resulting responses are analogous to slopes of supply and demand curves, although the dynamic nature of the equations implies that they are not direct representations of either short-run or long-run elasticities. If the demand shock engenders oscillations in supply, we can furthermore diagnose the presence of intrinsic cyclicality.
Note: (a) Response to a 1 percentage point shock.
Note: (a) Response to a 1 percentage point shock.
Note: (a) Response to a 1 percentage point shock.
Note: (a) Response to a 1 percentage point shock.
Note: (a) Response to a 1 percentage point shock.
Note: (a) Response to a 1 percentage point shock.
Next, we explore the interest sensitivity of the sector by tracing out the effects of a 1 percentage point shock to the policy interest rate (black lines in each panel of Figures 5 to 10). Since an increase in interest rates shifts both the demand and supply schedules left, these dynamic responses confound slopes and shifts in the notional curves implied by the econometric results. To ensure some comparability between the two sets of impulse responses, we have calibrated the supply and demand shocks to be the same as the direct effects of a 1 percentage point shock to the policy rate on supply and demand respectively.[8] All results are presented as the log deviation from baseline, scaled up by a factor of 100; this can be interpreted as a percentage deviation from baseline.
In the case of the US (Figures 5 and 6), there is no distinction between a demand shock and an interest rate shock, since in the preferred specification, interest rates only enter into the demand-side equations. That said, the results imply that supply is more price-elastic than demand. The quantity response to a contractionary demand shock or interest rate shock is greater than the apparent price response. In contrast, a contractionary supply shock results in a shift in demand that mainly changes prices rather than quantities. The effect of an interest rate shock is accordingly concentrated in quantities rather than prices, especially in the post-deregulation period. In line with the findings of McCarthy and Peach (2002), our results suggest that the housing demand in the US became less interest-sensitive following the deregulation of the financial sector.
In contrast, the results for the UK are consistent with demand being more price-elastic than supply. Figures 7 and 8 show that a demand shock traces out a much greater price effect relative to the quantity effect on supply than is the case for the effect of a supply shock on demand. Although confounded by the inclusion of public housing construction, this implies that the notional supply curve is relatively steep, especially in the pre-deregulation period, which is consistent with the overall pattern of housing construction moving relatively little over the course of the cycle. It is therefore not surprising that both the price and quantity effects of an interest rate shock are quite large relative to the results for the US.
The results for Canada (Figure 9) are also consistent with a relatively flat (price-elastic) notional demand curve that shifts substantially in response to an interest rate shock. Unlike the UK, however, the total response to a change in interest rates is dominated by a quantity adjustment rather than a price adjustment. That is, the housing sector as a whole is more elastic in the face of shocks than its UK counterpart. Indeed, of the four countries studied here, only in Canada does the effect of a move in interest rates weigh more heavily on structure prices (ps) than on the total price of established housing including land (ph). The implied response of land prices must therefore be relatively subdued, which suggests that land availability is less of a constraint on housing construction in Canada than in the other countries studied here. This ties in with other evidence suggesting that the level of housing prices is relatively low in Canada (Ellis and Andrews 2001). One reason for this might be that a greater proportion of the Canadian population lives in middle-sized cities where congestion costs are limited. This greater availability of land might contribute to the relatively elastic response of quantity supplied.
Finally, Figure 10 shows that only the Australian housing sector displays significant intrinsic cyclicality, as evidenced by the oscillations in quantity supplied following a demand shock. Only the pre-deregulation period for the US shows similar behaviour, and not to the same extent. Looking beyond this cyclicality, it appears that both supply and demand in Australia are quite elastic, with the ratio of the price response to quantity response being comparable to the US on the demand side, and Canada on the supply side. Similarly, the combined effect of a shock to interest rates on dwelling investment and house prices is the largest of the four countries studied.
Footnotes
A version of the model including an equation for construction costs in the model did not materially change the results. [5]
This specification of income was extended to the short-run dynamic terms for consistency. [6]
Although statistical tests exist for dating structural breaks in multivariate data (Andrews 1993; Bai, Lumsdaine and Stock 1998), we are not aware of any work on the properties of these tests in an instrumental variables framework. [7]
That is, the shock is calibrated so that the direct, short-run effects are the same as for the interest rate shock. In the UK and the US, we shocked structure prices by 1 per cent even though interest rates did not enter that equation. [8]