RBA Annual Conference – 2002 A Stormy Day on an Open Field: Asymmetry and Convergence in the Global Economy Nancy Birdsall[1]
1. Introduction
Openness is not necessarily good for the poor. Reducing trade protection has not brought growth to today's poorest countries, including many in Africa, and open capital markets have not been particularly good for the poorest households within many developing countries, including many of the emerging market economies of Asia and Latin America.
Too often, the word ‘openness’ has been used to embrace the entire scope of policies and outcomes that characterise a healthy economy. But this makes ‘openness’ unachievable from a policy point of view. Here, I use the word to refer narrowly to an open policy stance, the opposite of protectionism. Defined this way, ‘openness’ does not, unfortunately, guarantee growth, and in some circumstances it makes poverty reduction more difficult.
Many students of globalisation have remarked that certain countries and groups have been ‘marginal’ to the process.[2] It is less often remarked that many have remained marginal despite being, by some measures, ‘open’. That this is so is of course perfectly consistent with the evidence that trade is good for growth and growth is good for the poor, since what is true on average need not be true for every country.[3] But it does put a different spin on that evidence, one that raises concerns about the way the global economy is working that proponents of market-led globalisation have tended to overlook.
The particular concern I want to emphasise is that globalisation, as we know it today, is fundamentally asymmetric. In its benefits and its risks, it works less well for the currently poor countries and for poor households within developing countries. Because markets at the national level are asymmetric, modern capitalist economies have social contracts, progressive tax systems, and laws and regulations to manage asymmetries and market failures. At the global level, there is no real equivalent to national governments to manage global markets, though they are bigger and deeper, and if anything more asymmetric. They work better for the rich; and their risks and failures hurt the poor more.
In fact, we think of globally integrated markets as generally open and competitive, providing the paradigmatic level playing field. In the series of contests on this level playing field, there's plenty of room for disagreement and wrangling among teams (countries) about the rules and their interpretation and implementation. So the team owners constitute themselves members of a league (as in the World Trade Organization (WTO), the Bank for International Settlements and so on) and in the interests of the game they get together often to agree on the rules, adjust them to changing times, and manage their application.
The problem is that a level playing field and good rules are not sufficient to ensure competitive games. If some teams have better equipment, more training, and a long and successful history with money in the bank to sustain the investments that help them retain their advantages, then they are likely to win the league year after year. In soccer the big, powerful and wealthy teams tend to stay in the premier division, and the teams in the third or lower divisions rarely move up. In US baseball the richer, big city teams, such as the New York Yankees, tend to dominate year after year. In sports leagues, however, a lack of competition cannot persist for long. If the spectators lose interest the team owners lose money, so the team owners collaborate to implement rules that minimise the problem – such as the order of draft picks or caps on teams' spending on salaries. But here the analogy to the global market system breaks down because national governments face much greater obstacles to the kind of collaboration that team owners can manage.
Obviously a level playing field is insufficient to ensure competitive games if the rules of the game have been designed to favour one type of team over the other, or if the referee, in implementing sensible rules, consistently favours one side over another.[4] In the case of poor versus rich countries, the protection of agriculture and textiles by the rich is a good example of a rule designed to favour one type of team over another. Sometimes it is the interpretation or implementation of WTO rules that seems to favour one side. The interpretation of the TRIPs (Trade-Related Intellectual Property Rights) agreement (as limiting the use of compulsory licensing in public health emergencies) for a while reflected backdoor pressure of the United States on the referees. Then there is the case of antidumping. A few of the bigger teams have players who are prepared to interrupt the game (crying injury!) when they are beginning to lose their advantage. Smaller teams are learning the trick too, but will never have the same resources to make their interruptions stick. (At some point the owners may have to tighten up the injury rule if they want to preserve the integrity of the game.)
In this note, however, I do not focus on the unfair rules and their imperfect interpretation and implementation (though that subject merits considerable discussion in itself).[5] Instead I concentrate on two more subtle shortcomings of open global markets for the poor. I state them here, continuing with the sports league metaphor, and in two subsequent sections discuss and document them.
First, openness in open global markets does not necessarily lead countries to grow (and growth is necessary if not always sufficient for reducing poverty). Like sports teams, countries without the right equipment are in trouble from the start – even on a perfectly level playing field. Countries highly dependent on primary commodity exports two decades ago provide a convincing example. Their particular training and equipment, in retrospect, seems to have condemned them indefinitely to the lowest division in the globalisation league.
Second, for weaker teams with the wrong equipment and inadequate training, openness may actually be dangerous. For weaker teams, bumps in the level playing field (market failures/negative externalities) are hard to handle. A ruined pass or a twisted ankle (on a rough soccer field) can be particularly costly, and the less experienced players on weak teams may be especially vulnerable.
2. Openness does not Necessarily Lead to Growth
Consider the situation of many of the world's poorest countries, including most of the poor countries of Sub-Saharan Africa. Many are highly dependent on primary commodity and natural resource exports. In Birdsall and Hamoudi (2002), we define a group of countries in terms of the composition of their exports in the early 1980s. Using data on exports for 115 developing and 22 developed countries for each year between 1980 and 1984, we classified all exports (except those in SITC 9 – ‘unspecified’ products) as primary commodities or manufactures. For each country in each year we then calculated the share of primary commodities in total (specified) exports. Developing countries that fell into the top-third of primary commodity exporters for at least four of the five years we labelled as ‘most commodity dependent’ (34 countries), and those that fell into that category for zero or one year we labelled as ‘least commodity dependent’ (72 countries). All the developing countries were in fact highly commodity-dependent, with the average share of primary commodities in total exports for the least and most commodity-dependent groups at 62 and 98 per cent respectively. More to the point of this paper, the most commodity-dependent countries (defined as of the early 1980s) have not been any more reticent than the least commodity-dependent countries about participating in international trade. They:
- generally traded as much as countries in the category of ‘least commodity dependent’ between 1960 and 1980, if the level of trade is measured in terms of the ratio of exports plus imports to GDP (Figure 1);
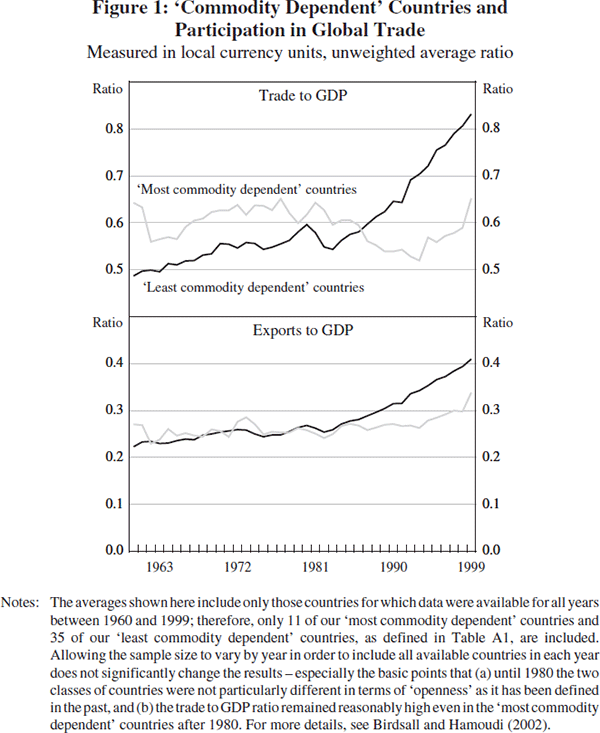
- continued to participate in global markets in the period 1980–1995 by this definition, with an export to GDP ratio in the year 1999 similar to the ratio among the ‘least commodity dependent’ countries (Figure 1); and
- have been as open from a policy point of view as the ‘least commodity dependent’ group.[6] For example, their tariff rates have been at or below the rates of the least commodity-dependent group. For countries in the two groups for which we have data on tariff rates, the most commodity-dependent group cut their tariffs from an average of 24 per cent in the late 1980s to 17 per cent in the late 1990s; the least commodity-dependent countries cut their tariff rates more, but from a higher initial rate in the late 1980s to the same average rate in the late 1990s, i.e., from 29 per cent to 17 per cent (see Table 1).
| Tariff rates | ‘Least commodity dependent’ countries | ‘Most commodity dependent’ countries | |
|---|---|---|---|
| 1985–89 | Mean | 0.29 | 0.24 |
| Median | 0.22 | 0.30 | |
| No of countries | 45 | 20 | |
| 1995–97 | Mean | 0.17 | 0.17 |
| Median | 0.13 | 0.17 | |
| No of countries | 45 | 20 | |
| Notes: Mean and median tariff rates among the ‘most commodity dependent’ and ‘least commodity dependent’ countries. The commodity-dependence classifications are as shown in Table 2 of Birdsall and Hamoudi (2002). Tariff rates are as reported in Dollar and Kraay (2001). Tariff data are only available for 45 of the 72 countries in our ‘least commodity dependent’ classification, and 20 of the 34 in our ‘most commodity dependent’ classification. For more details, see Birdsall and Hamoudi (2002). | |||
But despite their substantial engagement in trade and the decline in their tariff rates, the most commodity-dependent countries have failed to grow, especially after 1980. They grew at lower rates than the least commodity-dependent group in the 1970s and 1980s, and have not grown at all since 1980 (Table 2).[7]
| Average annual rate of growth of real PPP-adjusted GDP per capita | ‘Least commodity dependent’ | ‘Most commodity dependent’ | |
|---|---|---|---|
| Growth during the 1980s |
Mean | 0.011 | −0.009 |
| Median | 0.005 | −0.013 | |
| 25th percentile | −0.007 | −0.024 | |
| 75th percentile | 0.030 | 0.004 | |
| No of countries | 65 | 32 | |
| Growth during the 1990s |
Mean | 0.015 | 0.000 |
| Median | 0.017 | 0.004 | |
| 25th percentile | 0.000 | −0.016 | |
| 75th percentile | 0.032 | 0.016 | |
| No of countries | 68 | 28 | |
| Notes: Growth experience for the ‘most commodity dependent’ and ‘least commodity dependent’ countries. The classification of countries is as shown in Table 2 of Birdsall and Hamoudi (2002). Average annual rates of growth of real PPP-adjusted GDP per capita during the 1980s and during the 1990s are taken from the data set underlying Dollar and Kraay (2001), which the authors were generous to share. The samples do not include all 34 ‘most commodity dependent’ and 72 ‘least commodity dependent’ countries because some countries had to be dropped for lack of income data. In the ‘most commodity dependent’ group the observations which had to be dropped were: DR Congo (1990s), Liberia (1990s), Libya (1980s and 1990s), Saudi Arabia (1980s), Sierra Leone (1990s), Somalia (1990s), and United Arab Emirates (1980s); and in the ‘least commodity dependent’ group: Afghanistan (1980s and 1990s), Côte d'Ivoire (1980s), Djibouti (1980s), Guyana (1980s), Kiribati (1980s), Kuwait (1980s), Lebanon (1980s and 1990s) and New Caledonia (1980s and 1990s). All statistics are unweighted. For more details, see Birdsall and Hamoudi (2002). | |||
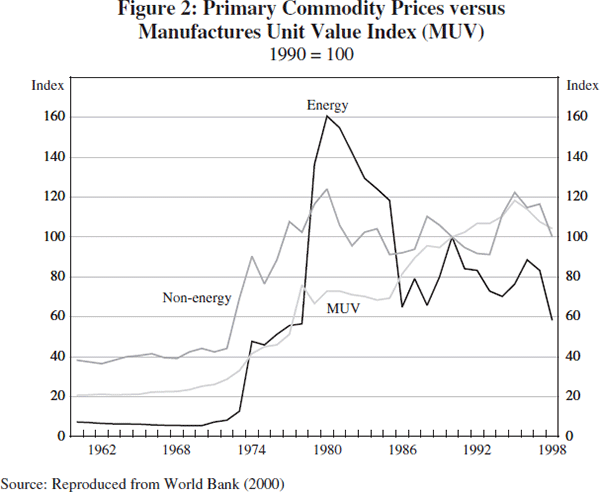
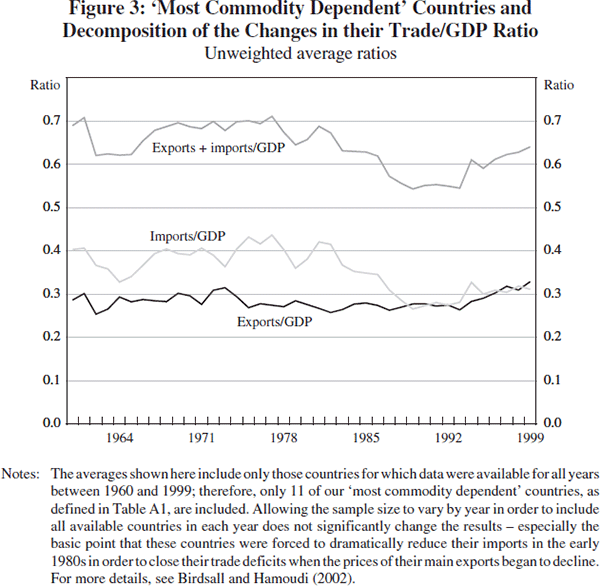
What happened? The countries that were most commodity dependent in the early 1980s entered that decade as relatively successful exporters of goods whose relative prices had been steady in the 1960s and increased rapidly in the 1970s (Figure 2). In the early 1980s, when the prices of their principal exports began to decline, their export revenue and capacity to import fell. Despite that decline in their terms of trade, they for the most part failed to diversify their exports. The problem may have been that producers and investors believed that relative prices would recover. More important, most of the countries dependent on primary commodities had accumulated debt; when the value of their exports fell, they lost access to additional borrowing and were forced to cut imports and unable to diversify. Figure 3 shows the large drop in their imports in the 1980s, and the relatively low level compared to the 1970s ever since. It is also likely that their infrastructure, governance, human capital and overall institutional setting were not propitious for diversification.
Whatever the reason, the fact remains that these countries have been ‘open’ for more than two decades – in the sense that they have been clearly engaged in global markets, and have reduced their own tariff rates. But with the value of their exports stagnating or even declining over the past two decades, their capacity to increase imports has been reduced. As a result, the amount of trade that occurs between these countries and the rest of the world has failed to increase relative to their GDP increases.
In short, their initial and continuing relatively high degree of openness has not bought them subsequent healthy rates of growth. Their lack of growth is apparently due to factors that have little to do with whether they are open, and much to do with their continuing dependence on commodity exports. In addition to the direct fiscal and import constraints, it seems likely that they are trapped in some sort of bad equilibrium, in which commodity dependence is associated with institutional failures[8] that have made escape from commodity dependence difficult. In settings where initial political and economic institutions are relatively weak, production based on natural resources appears to encourage predatory government behaviour and rent-seeking and to discourage development of the predictable, stable, democratic institutions that are conducive to growth. It also provides poor incentives for human capital investment, and discourages learning by doing, knowledge spillovers and increasing use of technology, at least compared to production of manufactured goods.[9] Of course there are other possible traps besides heavy dependence on commodity exports in the early 1980s (though they may well be highly correlated with and reinforced by such dependence). Frankel and Romer (1999) present evidence of the effect of what might be called trade-enhancing geography (or conversely trade-reducing geography) on growth, including the effects of country size (small size is bad for growth) and landlocked status (bad). The impact of trade-enhancing geography on growth is large and positive, perhaps because good geography enhances not only trade itself but also other ‘income-enhancing interactions’ such as the spread of ideas.
To return to the sports metaphor, success in global markets depends on arriving at the game with the right equipment and training. Most of the countries with a comparative advantage in primary goods in the early 1980s (unless they already had developed good institutions) have not done well – no matter how open they have been – on the level playing field.[10] At least for the last two decades, their resources have turned out to provide the wrong equipment for the globalisation game.[11] This does not imply that these countries would have been better off with more protectionism – only that lack of policy openness is not the constraint to their future growth.
3. Openness May Be Dangerous
There is also evidence that the poor within countries benefit less (and may even lose in absolute terms) from openness in trade and in the capital account. Two issues are worth setting out: first, the relationship between openness in both trade and the capital account and volatility; and second, the effects of an open capital account on income inequality within countries.
3.1 Openness, volatility and the poor
For all countries, Easterly, Islam and Stiglitz (2000) show that both the ratio of trade to GDP and of the standard deviation of capital flows to GDP are correlated with volatility in growth rates. Their multivariate regressions of the volatility of growth across countries suggest that ‘openness’ (defined using the trade to GDP ratio[12]) leads to increased volatility. This is so especially in developing countries; the effect is almost completely attenuated in rich countries. Though openness defined as private capital flows to GDP is not statistically significant, their indicator of financial depth (the ratio of credit to the private sector to GDP) appears to be key to reducing growth volatility. Again it is the developing countries that are vulnerable, with private sector credit to GDP of only 25 per cent on average, compared to 64 per cent in the OECD countries (in the Easterly et al (2000) sample).
Thus it is not surprising that the volatility of growth has been much greater overall in developing countries – more than twice that in OECD countries in the Easterly et al (2000) sample. Combined with lower mean annual growth (0.7 per cent with a standard deviation of 6.1 per cent, compared to 2.7 per cent for the OECD countries with a standard deviation of 2.6 per cent[13]), their downside volatility has clearly embraced some negative growth spells. Negative growth spells are in turn particularly bad for the poor.
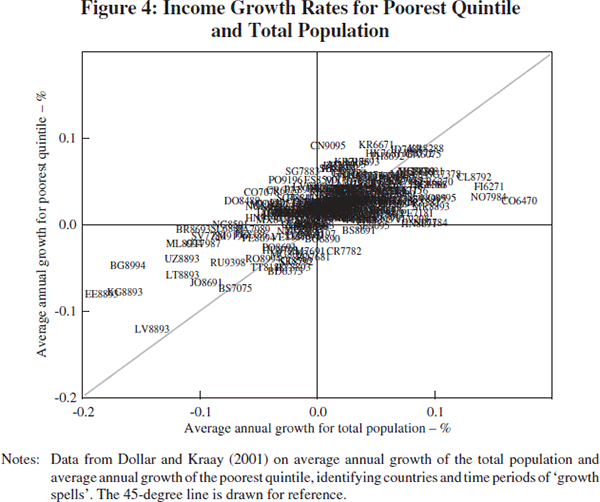
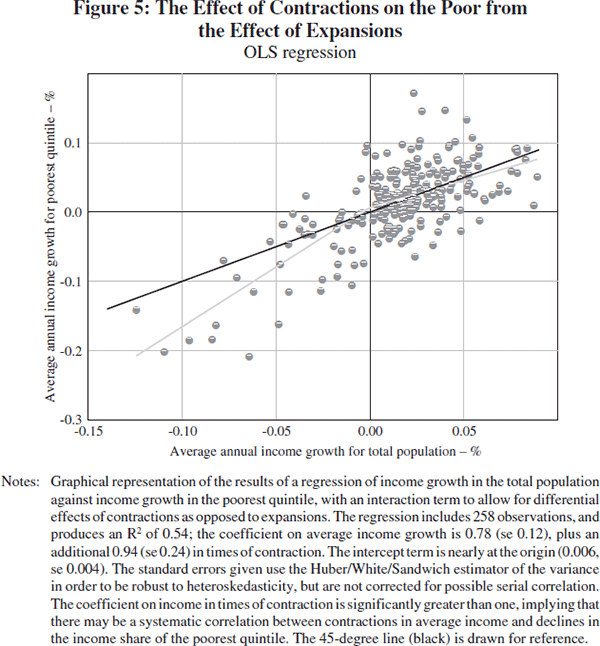
Consider Figure 4, which simply uses data from Dollar and Kraay (2001) to plot the annual income growth rate of the poor on the average annual overall income growth rate for a sample of countries during various growth spells. The evidence suggests that though expansions are on average good for the poor, contractions are more than proportionately bad for the poor. Figure 5 shows the results of a simple OLS regression, including an interaction term[14] to distinguish the effect of contractions on the poor from the effect of expansions. The slope of the best-fit line in the southwest quadrant is about 1.6; in the northeast quadrant, it is only about 0.8. Of course, we must be mindful of the fact that the countries and time periods in the southwest quadrant are different from the countries and time periods in the northeast quadrant, and it may be that contractions and expansions in different places have very different effects on the poor. (The observations in the southwest quadrant include not only the growth spells in the transition economies of Eastern Europe and the former Soviet Union, but also spells in Mali, Peru, Brazil, Guatemala, Zambia, Jordan, Mexico, Honduras, Nigeria, and others.) This suggests an important qualification to Dollar and Kraay's findings about the general relationship between average growth and the share of the poor (see Table 3).[15]
| Dependent variable: average annual proportional change in poverty headcount | Full sample | Only negative growth spells |
Only positive growth spells |
Full sample | Full sample, excluding EEFSU |
|---|---|---|---|---|---|
| Average annual income growth during spell | −2.161 (0.375)** |
−1.008 (0.834) |
−1.292 (0.770) |
−1.620 (0.450)** |
|
| −2.384 (0.655)** |
|||||
| As above if above is negative; otherwise, zero | −1.490 (1.064) |
−1.209 (0.832) |
|||
| Constant | 0.003 (0.022) |
0.011 (0.058) |
−0.054 (0.040) |
−0.032 (0.033) |
−0.042 (0.028) |
| Observations | 125 | 46 | 79 | 125 | 109 |
| R2 | 0.25 | 0.19 | 0.03 | 0.26 | 0.33 |
| Notes: OLS regressions relating average annual proportional change in the
poverty headcount to average annual income growth. Data are taken from
the data set underlying Ravallion (2001) and Chen and Ravallion (2000),
which Ravallion was generous to share. The variable in row 3 is an interaction
term of average annual income growth with a dummy indicating whether average
annual growth was negative. ‘Robust’ standard errors in parentheses (using the Huber/White/Sandwich estimator of the variance). * and ** indicate significant at the 5% and 1% levels, respectively. EEFSU: Eastern Europe and the Former Soviet Union |
|||||
Openness, because it increases the likelihood of volatility, can therefore indirectly hurt the poor within developing countries. For example, Lundberg and Squire (1999), using country data on changes in income for different quintiles of the income distribution, report that the negative consequences of terms of trade changes are ‘far greater’ for the poorest 40 per cent than for the middle 60 per cent and wealthiest 40 per cent of households (overlapping groups), with that vulnerability, not surprisingly, exacerbated by a country's openness.[16]
In the case of trade, we observe that poor countries and poor people within countries can lose out when they enter markets that work, in which prices reflect reasonably well supply and demand. In the case of capital markets, the poor suffer because global markets fail, and interact with developing countries' relatively weak domestic markets and government failures in ways that increase risks.
The failures of financial markets are well known; the global financial crises of the 1990s were only the most recent in a long history of financial bubbles that have burst. Financial crises are not special to poor and emerging markets; but the crises of the last decade suggest that whether induced by domestic policy problems or global contagion (or the combustible mix of both), the same crisis can be more costly for relatively poorer countries, if only because their local financial markets are thinner and less resilient and local and foreign creditors more skittish than in deeper markets.[17] Indeed one of the ironies of globalisation may be that emerging market economies, if they are to exploit the benefits of a global market, simply cannot afford the policy errors and institutional weaknesses that are characteristic of being ‘emerging’.
Despite those risks, the trend among developing countries over the past three decades has been toward greater capital market openness; the number of developing countries declaring their currencies convertible on capital account transactions increased from 34 (30 per cent of IMF member countries) to 143 (77 per cent) between 1970 and 1997 (Dailami and ul Haque 1998). It makes sense for countries that are capital-scarce to open their capital accounts, and in principle an open capital account could make it easier for a country to manage shocks. On the other hand, an open capital account in good times raises problems and in bad times makes it easier for capital to exit as well as enter, including due to an external shock such as a liquidity crisis elsewhere in a global market.[18] In emerging market economies, that has tended to reinforce a self-fulfilling loss of confidence. The problem for the poor is compounded because to restore confidence, emerging markets are forced to abstain from otherwise sensible countercyclical fiscal and monetary policy – and therefore have difficulty sustaining the social insurance programs on which the poor necessarily rely during downturns.
We cannot conclude that openness is a principal cause of volatility, and certainly not that closing trade markets and the capital account would reduce volatility or increase growth. Indeed growth in the developing world could well have been even lower than it has been with less open trade and capital markets (although China and India have remained relatively closed they are large enough economies to have large internal markets). But neither can we deny that with greater average dependence on exports whose prices are volatile and on financial markets that are smaller and less resilient, among other problems typical of developing countries (thus they are ‘developing’ not developed), openness poses greater risks than it does for the richer economies, and is particularly risky for the poor within developing countries, especially to the extent that it increases the risks of negative growth spells and compounds the difficulty of managing a countercyclical social safety net.[19]
3.2 Open capital markets and inequality within developing countries
An additional problem is that open capital markets are likely not only to slow poverty reduction, but to contribute to persistent or even worsening inequality within developing countries, in particular increasing the income gap between the rich and other households. To the extent that open capital markets contribute to inequality, they may indirectly reduce growth, since in developing countries inequality seems to exacerbate the negative effects of weak capital and other markets on growth, and may contribute to social and ethnic tensions that make good management of the economy politically difficult.[20]
Less noted is the fact that open capital markets also seem to be associated with the persistence of income inequality. In part this turns out to be the case for ‘good’ reasons. For example, because capital and skilled labour are complementary, increased access to capital is likely to increase the returns to highly skilled labour and thus increase the wage gap between the skilled and unskilled. Behrman, Birdsall and Székely (2000) report dramatic increases in the return to higher (post-secondary) education in most countries of Latin America, especially compared to secondary education. They test the effects of various liberalising economic reforms on the wage differential between the skilled and unskilled, using household survey data combined with country and year-specific indices of policy, across 28 countries of Latin America over several decades.[21] Their results indicate that capital account liberalisation (and domestic financial market liberalisation) are associated with an increase in the wage differential that is substantial for several years and then diminishes.[22] This market-led effect is not small, but in principle it should increase the demand for higher education as an equilibrating mechanism, and indeed that is likely to be happening in Latin America and worldwide.
More disturbing is the evidence of more patently non-market and ‘unfair’ disadvantages for lower-income groups associated with open capital markets. In Turkey, Argentina and Mexico, with repeated bouts of inflation and currency devaluations in the last two decades, the ability of those with more financial assets to move those assets abroad, often simultaneously acquiring bank and corporate debt that is then socialised and paid by taxpayers, has almost certainly increased inequality.[23] In east Asia, inequality of income increased (in Thailand and Malaysia, and probably in Indonesia) during the boom years of high capital inflows in the mid 1990s; as portfolio inflows and high bank lending fuelled demand for assets such as land and stocks, inequality of wealth no doubt increased even more, though data on the distribution of wealth are not reliable (due mostly to under-reporting) and many of those who accumulated wealth no doubt lost much of it when the crisis hit. Still, some evidence suggests that the lower-middle and working classes in those countries were hit hardest by the crisis, especially in terms of lost employment[24], and to the extent the poor also lost out, their losses in welfare terms would be particularly great. In addition there is the likelihood that the high interest rates to which the affected countries resorted to stabilise their currencies – both in east Asia and then in 1998–99 in Brazil – also had a redistributive effect, hurting most capital-starved enterprises and their low-wage employees.
In addition, the bank bailouts that generally follow financial crises tend to create substantially more public debt relative to GDP in developing than in developed countries. Indonesia's recent financial crisis cost it 45 per cent of GDP.[25] The cost of crises in developing countries is usually over 10 per cent of GDP compared to below 5 per cent in the OECD. The US savings and loan crisis of the early 1990s cost an estimated 2–3 per cent of GDP (Norton 1997). The resulting high public debt in developing countries usually helps sustain high-income inequality, since public debt generally implies a transfer from taxpayers to rentiers. Even when depositors are protected, the distributive effect is probably perverse, as long as depositors are on average from higher-income households than taxpayers. That seems a good possibility in many developing countries, since they tend to rely heavily on indirect trade taxes and the value-added tax, which are not progressive. There is also the point that the poor benefit more from higher public expenditures, and the medium-term effect of the public financing of bailouts is to reduce public expenditures from whatever they might have been.[26]
Consistent with the story above, Diwan (2001) finds, using a panel of country data, that the share of labour in GDP usually falls sharply following a financial crisis, and recovers only partially in subsequent years. He suggests that the declining labour share reflects not only the relatively automatic asymmetry in the effects of crises to which I have referred, but also a ‘change in the distribution rules’ with crises. If the state feels compelled to bail out the banking sector (to avoid a run on deposits and a collapse in output), it is likely to be labour that in the short run finances the bailout through reduced employment and real wage cuts.[27] With capital able to shield itself more easily from the costs of adjustment, labour takes the brunt of the adjustment. His results are also consistent with our estimations above of the disproportionate effect of contractions on the income of the poor, assuming there is a correlation between effects on the labour share and effects on the poor.
4. Implications
That openness is not necessarily good for the poor does not imply that it is necessarily bad for the poor. Only that it all depends. It depends on the resolution of two existing asymmetries in the way the global economy operates. (In addition to these two asymmetries there is the problem that the powerful make and implement the rules, as the limited access of developing countries to certain rich country markets suggests. That problem, though politically difficult to fix, is conceptually straightforward, and even avid globaphiles would agree that change is needed.)
First, some teams are trying to play without the right equipment. On a level playing field, participation in the game by ill-equipped teams does not provide an equal opportunity to win. Open markets (a level playing field) naturally reward most those who are well-equipped and trained – in economic terms those who already have the most productive assets. At the individual level, those with land, financial assets, and human capital naturally have a leg up. The analogue of these individual assets at the country level seems to be effective and stable political and social institutions, particularly deep financial markets – a characteristic still confined almost completely to the OECD economies. Countries that are already ahead, with deep financial markets, stable political systems, secure property rights, adequate banking supervision, reasonable public services, and so on, have a much higher probability of staying ahead. They are able not only to adjust and diversify their economies in the face of changing global opportunities, but to attract more local and foreign investment, better exploiting their own peoples' entrepreneurial energy and skills. Though it is true that, all other things the same, capital will flow to places where it is most scarce because those are the places where its return will be highest, and that therefore convergence in income across countries ought to happen, it is also true that all other things are not the same. Because they are not the same, as much as 80 per cent of all foreign investment occurs among the industrialised countries, and just 0.1 per cent of all US foreign investment went to Sub-Saharan Africa in 2000 (UNCTAD 2001).
Second, the global market is far from perfect. Its market failures create risks for all countries, but the risks are asymmetric – greater for the more vulnerable developing countries. The evidence is clear in their greater growth volatility, the higher cost to them of financial crises, and the special risk that their government and institutional failures will combine with weak markets to exacerbate and perpetuate high inequality – in turn reducing their growth.
These two asymmetries put the idea of convergence in the income and welfare of rich and poor countries, and of rich and poor individuals, at risk. The status quo of the global economy does not produce the equal economic opportunities for all that would justify the mainstream view that the current global regime will more or less automatically bring growth and poverty reduction to everyone – if only all countries would get ‘globalised’. Like domestic economies, the global economy needs the civilising hand of appropriate intervention if we are to see a reduction in global poverty and increased income convergence across countries. What that appropriate intervention would be is too large and complex a topic to tackle here. But it would surely include more transfers from rich to poor countries than the current 0.3 per cent of the formers' combined GDPs (compared to transfers from rich to poor in the US more than 10 times as great), and more active management of such global problems as money laundering, tax evasion, sovereign bankruptcy, and capital flight, not to speak of global health and environmental issues. Because the market works and rewards more the more able and productive, the global economy would be enriched in the long run by a global social contract that financed equal opportunity investments in the initially weak and disadvantaged countries.[28] And because the global market is ridden with the usual market failures, we need global arrangements that, via some mechanisms equivalent to the usual taxes, subsidies, and regulatory arrangements we have in modern capitalist economies, reduce the difference between individual country returns and the social return to the global economy and all its players.
Thus the discussion of whether globalisation and openness are good or bad for the poor should move on to a discussion of the appropriate global social contract and appropriate global arrangements for minimising the asymmetric risks and costs of global market failures.
Appendix
| Least commodity dependent (1980–84) |
Most commodity dependent (1980–84) |
Neither most nor least commodity dependent | |
|---|---|---|---|
| Non-globalisers | Benin; Burkina Faso; Egypt; El Salvador; Fiji; Guatemala; Honduras; Indonesia; Israel; Kenya; Madagascar; Mauritius; Morocco; Pakistan; Peru; Senegal; South Africa; Sri Lanka; Syria; Togo; Trinidad & Tobago; Tunisia | Algeria; Burundi; Cameroon; Central African Republic; Rep Congo; DR Congo; Ecuador; Gambia; Ghana; Iran; Mauritania; Myanmar; Nigeria; Papua New Guinea; Sierra Leone; Venezuela; Zambia | Chad; Gabon; Guinea-Bissau; Malawi; Niger |
| Globalisers | Argentina; Bangladesh; Brazil; China; Colombia; Costa Rica; Côte d'Ivoire; Dominican Rep; Haiti; Hungary; India; Jamaica; Jordan; Malaysia; Mexico; Nepal; Nicaragua; Philippines; Thailand; Uruguay; Zimbabwe | Mali; Rwanda | Paraguay |
| Not included in Dollar and Kraay |
Afghanistan; Albania; Barbados; Belize; Bhutan; Bulgaria; Cambodia; Comoros; Cyprus; Djibouti; Guyana; Hong Kong; Kiribati; Kuwait; Laos; Lebanon; Maldives; Malta; Mongolia; Mozambique; New Caledonia; Panama; Poland; Romania; Seychelles; St Kitts & Nevis; South Korea; Tanzania; Vietnam | Angola; Bahamas; Bolivia; Ethiopia; Guinea; Liberia; Libya; Oman; Saudi Arabia; Solomon Islands; Somalia; Sudan; Suriname; Uganda; United Arab Emirates | Bahrain; Equatorial Guinea; Yemen |
| Total | 72 Countries (of which 43 included in Dollar and Kraay) | 34 Countries (of which 19 included in Dollar and Kraay) | 9 Countries (of which 6 included in Dollar and Kraay) |
| Notes: Reproduction of Table 2 from Birdsall and Hamoudi (2002). For detailed notes, see Birdsall and Hamoudi (2002). | |||
Footnotes
President, Center for Global Development (nbirdsall@cgdev.org). I am grateful for the comments of participants in the G-20 conference, especially Benoît Coeuré, David Dollar and Edward Gramlich, and to William Cline, William Easterly, Carol Graham, Ruth Levine, John Nellis, Sonal Shah, and John Williamson. I am particularly grateful to Amar Hamoudi for his comments, redrafts, and his usual creative approach to exploiting available data. [1]
A stronger statement is that the poor have been ‘marginalised’. That word suggests or at least allows for some effort by some party to push the poor to the margin, and seems too strong an assertion, or at least an assertion that would be hard to document. [2]
On growth is good for the poor, the recent study of Dollar and Kraay (2001) has been widely cited. See also World Bank (2001) on trade, growth and poverty. Ravallion (2001) shows that what is true on average is not true for every country or time period. [3]
Referring to unfair interpretation of trade rules, then-President Jorge Quiroga of Bolivia said in a recent speech at the Center for Global Development: ‘We were out of shape, high deficits…high tariffs…We got in shape…we started practising…So we come in and score a goal with our foot and they say ‘No, no, you can't do that, you can only score with your head.’ And we're not very tall to begin with, so it's kind of tough…Then we score a goal from 18 yards away and they say, ‘No, no, you can only score from 35 yards away’…huge agricultural subsidies that keep you out…And if you have a good midfielder, oops, red card, antidumping, he's selling too much, take him out…’ The rest of his extended metaphor is available at <http://www.cgdev.org>. [4]
Though I do not agree with some of the details, the recent Oxfam report (Oxfam International 2002) on the effects of the rich countries' protected markets on the poor raises many of the right points, as did President Quiroga. [5]
It is worth making a distinction between trade policies and what could be called ‘trade infrastructure.’ Winters (2001) notes that low tariff rates are misleading if they are unevenly and artificially applied, as in Uganda in the 1980s when there was dire conflict and considerable corruption by border and customs officials. But these kinds of barriers usually reflect not ‘trade policy’ or any policy intent, but poor governance and a weak state in general, leading to inadequate ‘trade infrastructure’, best thought of as a result of (endogenous to) a country's poverty and lack of growth. [6]
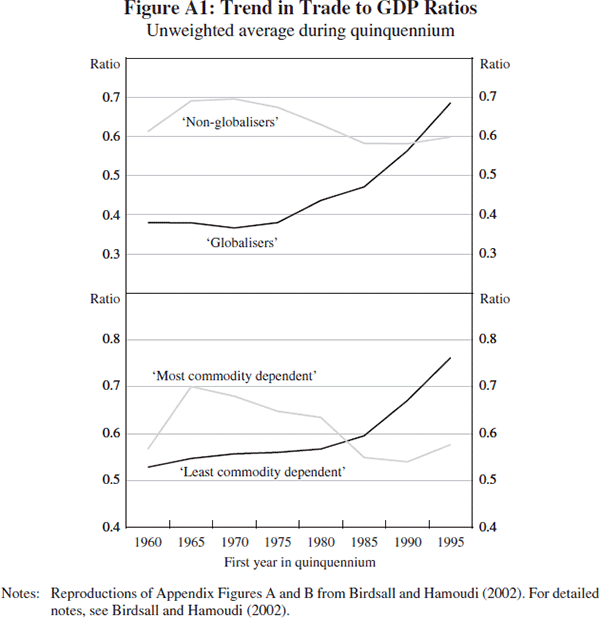
Our group of most commodity-dependent countries overlaps closely with the ‘non-globalisers’ in Dollar and Kraay's now well-known classification, as shown in Table A1. (The only ‘globalisers’ in our commodity-dependent group are Mali and Rwanda.) Their ‘non-globalisers’ were also ‘open’ in the early 1980s. However, their ‘non-globalisers’ are defined not in terms of countries' level of openness but in terms of their change in openness in the subsequent two decades. Non-globalisers are those where ‘openness’ did not increase in the last two decades (in comparison to globalisers where ‘openness’ did increase). Figure A1 compares the initial levels and trends using the two classifications. [7]
Highly commodity-dependent countries' difficulty in increasing their trade share may itself be bad for their governance. Krueger (1974) suggested that openness is likely to reduce rent-seeking; Ades and Di Tella (1999) show that a higher ratio of imports to GDP is associated with less corruption, and that a high proportion of fuels and minerals in exports is associated with more corruption. Wei (2000) shows that countries that are ‘naturally open’, including due to good geography, have better government institutions; corruption is negatively correlated with the difference between actual and predicted openness. [8]
Birdsall and Hamoudi (2002) include a brief review of the relevant literature. [9]
This is obviously not true for all commodity-dependent countries – Botswana, Chile, and Indonesia, have had high average growth rates since 1980. But it does appear to be true for our ‘most’ commodity-dependent countries – those for which in the early 1980s more than 90 per cent of exports were primary commodities. [10]
Moreover their failure to grow has apparently made it tough to acquire better equipment. This is the case even though some of the poorest countries have been receiving net annual transfers amounting to as much as 10 per cent of their GDP. Even discounting the value of net transfers to take into account that much of the aid has been tied and has come in the uncoordinated, and sometimes unpredictable, form of multiple projects financed by multiple donors, the failure to grow suggests that institutional problems have been paramount, and that dependence on commodity exports, if it has constrained growth, has done so for reasons beyond its disadvantages from a financial point of view. [11]
As emphasised and explained in Birdsall and Hamoudi (2002), the trade to GDP ratio is not meaningful as a measure of policy openness. What this finding really shows is that growth is more volatile in countries that run larger trade deficits, or have smaller populations, or are commodity- dependent. [12]
Their sample includes 74 countries in a panel created by aggregating over the periods 1960–78 and 1979–97. [13]
Dollar and Kraay do not include the interaction term that we use to distinguish negative growth spells. [14]
Similarly, a regression of the average annual proportional change in the poverty headcount against average annual income growth (along the lines of Ravallion (2001)) indicates that the effects of contractions increase the number of poor more than the effects of expansions increase their numbers. The poverty headcount is about twice as sensitive to income contractions as it is to income expansions, though that may simply reflect the larger number of people above compared to below the poverty line (in, for example, a log-normal distribution of income). [15]
Lundberg and Squire also conclude that the costs of adjusting to ‘openness’ have been borne ‘exclusively’ (their italics) by the poorest 40 per cent of households. Their results are suggestive but not definitive since they use the Sachs-Warner index of openness, which includes country characteristics such as the black market premium that reflect outcomes of many policies and not just of trade policy itself. [16]
Countries with a history of inflation, as is the case in the emerging market economies of Latin America, have the particularly grim problem that their bad history leads the markets to demand procyclical fiscal austerity during crises. [17]
Including pressures on the exchange rate, a greater risk of asset bubbles etc. Chile-type disincentives to restrain short-term capital inflows, along with high reserves to protect economies during global crises can help, but these also imply costs to emerging markets that the ‘emerged’ economies need not bear. [18]
Regressions of spells of income growth for the poorest quintile across countries in the 1990s, on the openness of countries' capital account and other standard variables suggested no obvious association between capital openness and the changing shares of the poor. However the measure of countries' capital openness, available from the IMF, exists for only a single year late in the 1990s; there is no measure that I could find of the change in capital openness. And the measure used is probably crude. There has been much less effort to quantify openness of the capital account than of the trade regime. [19]
For evidence that income inequality reduces growth in developing countries though not in developed countries (presumably because government and market failures are lesser in the latter), see Barro (2000). Birdsall (2001) discusses why inequality matters. Birdsall and Londoño (1997) emphasise that it is asset inequality, not necessarily income inequality itself, which is associated with low growth; they show that inequality of education and of land are associated with reduced growth across countries. See also Deininger and Olinto (2000). Aghion, Banerjee and Bacchetta (2000) suggest how unequal access to credit markets can reduce aggregate investment returns. [20]
They estimate differences in differences; the dependent variable is the difference between two survey points in the private rate of return to education for males aged 20 to 55. Their results demonstrate the relevance, and the limits, of Stolper-Samuelson. [21]
Other reforms, including trade liberalisation and privatisation have a zero (trade) or negative (i.e. beneficent, for privatisation) effect. The short-term ‘bad’ effects of the financial and capital account variables are sufficient to ensure an overall ‘bad’ effect of an aggregate country and year-specific reform index. [22]
Pfeffermann (2002) puts together the relevant pieces of data on crises and devaluations for Latin America, suggesting that if the rich can manage capital flight, they can exploit the crises. [23]
Birdsall and Haggard (2000) present evidence on this point. Consumption levels of these groups were mostly preserved, presumably by their using savings and otherwise reducing their assets. [24]
Author's calculations from World Bank (2002). [25]
Take the case of Argentina. The public sector assumed substantial debt in the early 1990s when the convertibility policy was introduced, and this reduced its ability to finance greater spending on social programs throughout the decade; the same phenomenon is likely to repeat itself given the 2002 crisis. [26]
The trigger can be a loss in public sector creditworthiness with confidence in the value of deposits eroding, as in Argentina recently, or private sector losses which the public sector ends up having to assume, as during the east Asian crisis. [27]
Thus we have such institutions as the World Bank and bilateral development assistance programs. They tend to operate more in the spirit of charity, however, than as part of a global social contract in which both ‘sides’ benefit. [28]
References
Ades A and R Di Tella (1999), ‘Rents, Competition, and Corruption’, The American Economic Review, 89(4), pp 982–993.
Aghion P, A Banerjee and P Bacchetta (2000), ‘A Simple Model of Monetay Policy and Currency Crises’, European Economic Review, 44(4/6), pp 728–738.
Barro RJ (2000), ‘Inequality and Growth in a Panel of Countries’, Journal of Economic Growth, 5(1), pp 5–32.
Behrman JR, N Birdsall and M Székely (2000),'Economic Reform and Wage Differentials in Latin America', Inter-American Development Bank Research Department Working Paper No 435, available at <http://www.undp.org/hdro/events/rioforum/szekely.pdf>.
Birdsall N (2001), ‘Why Inequality Matters: Some Economic Issues’, Carnegie Endowment for International Peace, Economic Reform Project Discussion Paper No 5.
Birdsall N and S Haggard (2000), ‘After the Crisis: The Social Contract and the Middle Class in East Asia’, Carnegie Endowment for International Peace, Washington DC, mimeo, available at <http://www.ceip.org/files/publications/pdf/AfterCr.pdf>.
Birdsall N and A Hamoudi (2002), ‘Commodity Dependence, Trade, and Growth: When “Openness” is Not Enough’, Center for Global Development Working Paper No 7, available at <http://www.cgdev.org/wp/cgd_wp007.pdf>.
Birdsall N and JL Londoño (1997), ‘Asset Inequality Matters: An Assessment of the World Bank's Approach to Poverty Reduction’, The American Economic Review, Papers and Proceedings, 87(2), pp 32–37.
Chen S and M Ravallion (2000), ‘How did the world's poorest fare in the 1990s?’, World Bank Development Research Group Working Paper No 2409, available at <http://wbln0018.worldbank.org/research/workpapers.nsf/0/7b824640b1ad2f1c8525692d007481b5/$FILE/wps2409.pdf>.
Dailami M and N ul Haque (1998), ‘What Macroeconomic Policies Are “Sound”?’, World Bank Macroeconomics and Growth Working Paper No 1995, available at <http://www.worldbank.org/dec/Publications/Workpapers/WPS1900series/wps1995/wps1995.pdf>.
Deininger K and P Olinto (2000), ‘Asset Distribution, Inequality, and Growth’, World Bank Policy Research Paper 2375.
Diwan I (2001), ‘Debt as Sweat: Labor, financial crises, and the globalization of capital’, World Bank, Washington DC, mimeo, available at <http://www.worldbank.org/wbi/B-SPAN/docs/diwan.pdf>.
Dollar D and A Kraay (2001), ‘Trade, Growth, and Poverty’, World Bank Macroeconomics and Growth Group Working Paper No 2615, available at <http://www.worldbank.org/research/growth/pdfiles/Trade5.pdf>.
Easterly W, R Islam and J Stiglitz (2000), ‘Shaken and Stirred: Explaining Growth Volatility’, paper presented at the World Bank's ‘Annual Bank Conference on Development Economics’, Washington, 18–20 April, available at <http://www.worldbank.org/research/growth/padate.htm>.
Frankel JA and D Romer (1999),'Does Trade Cause Growth', The American Economic Review, 89(3), pp 379–399.
Krueger AO (1974), ‘The Political Economy of the Rent-Seeking Society’, The American Economic Review, 64(3), pp 291–303.
Lundberg M and L Squire (1999), ‘The Simultaneous Evolution of Growth and Inequality’, World Bank, available at <http://www.worldbank.org/research/growth/pdfiles/squire.pdf>.
Norton R (1997), ‘The Big Costs of Policy Mistakes’, Fortune, 136(6), p 44.
Oxfam International (2002), Rigged Rules and Double Standards: Trade, Globalization, and the Fight against Poverty, Oxfam International, Washington DC, available at <http://www.maketradefair.com/assets/english/Report_English.pdf>.
Pfeffermann G (2002), ‘Income Inequality in Poor Countries: Forever Bad?’, author's draft.
Ravallion M (2001), ‘Growth, Inequality and Poverty: Looking Beyond Averages’, World Development, 29(11), pp 1803–1815.
UNCTAD (United Nations Conference on Trade and Development) (2001), World Investment Report: Promoting Linkages, United Nations, New York.
Wei S-J (2000), ‘Natural Openness and Good Government’, NBER Working Paper No 7765.
Winters A (2001) ), ‘Trade Liberalization and Growth: Implementation and Complementary Policies’, paper presented at the International Economic Study Group 26th Annual Conference, London, 15–17 September.
World Bank (2000), Global Economic Prospects and the Developing Countries 2000, The World Bank Group, Washington DC.
World Bank (2001), Globalization, Growth, and Inequality: Building an Inclusive World Economy, The World Bank Group and Oxford University Press, New York.
World Bank (2002), 2002 World Development Indicators, The World Bank Group, Washington DC.