Bulletin – December 2013 Financial Stability A Model for Stress Testing Household Lending in Australia
- Download the article 517KB
Abstract
Stress testing can be a useful tool for authorities to assess the resilience of their banking systems to various shocks, including those that result in more borrowers being unable to repay their debts. This article outlines a model that simulates household loan defaults and losses using data from a survey of Australian households. The model generates plausible results in response to shocks to interest rates, the unemployment rate and asset prices. It also provides a useful starting point for the Bank's development of a more holistic stress-testing framework for the Australian banking system.
Introduction
Stress tests, in their most common form, attempt to quantify the impact of adverse scenarios, such as recessions and serious financial shocks, on financial institutions. The output of these stress tests provides an indication of whether financial institutions are adequately capitalised and/or sufficiently liquid to withstand a ‘stress’ scenario. Stress tests are used by private financial institutions as part of their internal risk management, as well as by prudential supervisors and other authorities to assess vulnerabilities facing individual financial institutions or the financial system as a whole.[1]
Stress testing of banking systems has become more prominent since the onset of the global financial crisis, partly because authorities have wanted to make more forward-looking assessments of financial system resilience. Increasingly, central banks have undertaken stress tests (driven, in some cases, by experiences of banking sector distress during the global financial crisis), and a majority of advanced economy central banks now regularly stress test their banking systems (see ‘Box A: Central Bank Stress-testing Practices’ for an overview). Most central banks stress test credit risk – the risk that borrowers will not repay their debts – given its central role in past episodes of financial instability. Beyond that, they have adopted a wide range of stress-testing practices, with significant differences in coverage of other types of risk and modelling techniques. This diversity of approaches reflects the different prioritisation of risks in each jurisdiction, as well as differences in resources and data availability.
While the Reserve Bank has not historically conducted stress tests of the Australian financial system, it has contributed to stress tests of Australian banks undertaken by the Australian Prudential Regulation Authority (APRA) since the early 2000s.[2] The Bank also assisted with the stress tests undertaken by the International Monetary Fund (IMF) during its 2006 and 2012 Australian Financial Sector Assessment Programs (FSAPs) (IMF 2006, 2012). Following an IMF recommendation made after the 2012 FSAP, the Bank has decided to develop an in-house stress-testing framework for the banking system that is appropriate for Australia and accords with its financial stability mandate. Many considerations are influencing this process, including the structure of the Australian financial system, how best to complement APRA's ongoing program of supervisory stress tests of Australian banks, and data availability.
Stress testing of household loan portfolios is one component of a stress-testing framework that is relatively important in Australia, given that household loans account for around two-thirds of banks' lending, and a sizeable share of banks' balance sheets. However, as household indebtedness and gearing have risen considerably since Australia's last severe economic downturn in the early 1990s, results from standard econometric stress-testing methods based on historical aggregate data could give a misleading picture of the resilience of banks to household credit risk. The Bank has developed an alternative approach involving a simulation-based stress-testing model that relies on reported household financial characteristics, and should therefore capture developments in household balance sheets over recent history. The model uses household- and individual-level data from the Household, Income and Labour Dynamics in Australia (HILDA) Survey and was developed for research purposes (see Bilston and Johnson (forthcoming)). With refinement, it may also form part of the Bank's overall stress-testing framework.
Box A: Central Bank Stress-testing Practices
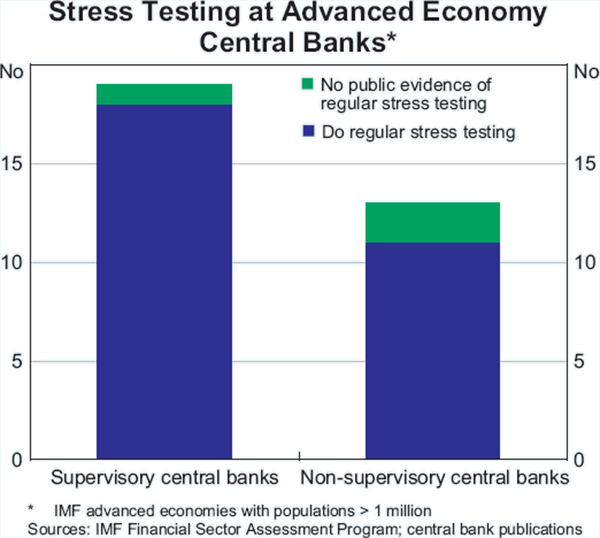
Most central banks in sizeable advanced economies now conduct regular stress tests of their banking systems (Graph A1).[a1] This includes most of the central banks that do not directly supervise private banks. Some began to develop stress-testing frameworks in the early 2000s, but many began doing so during or after the global financial crisis. Almost all stress-testing central banks undertake their tests in-house, although some supervisory central banks carry out tests that require analysis to be done by the banks being tested. Stress scenarios chosen by central banks generally revolve around recessions, but often also capture other shocks such as sharp declines in property prices. Apart from these commonalities, central bank stress-testing practices diverge considerably and, as they are (understandably) still very much under development, continue to change over time.
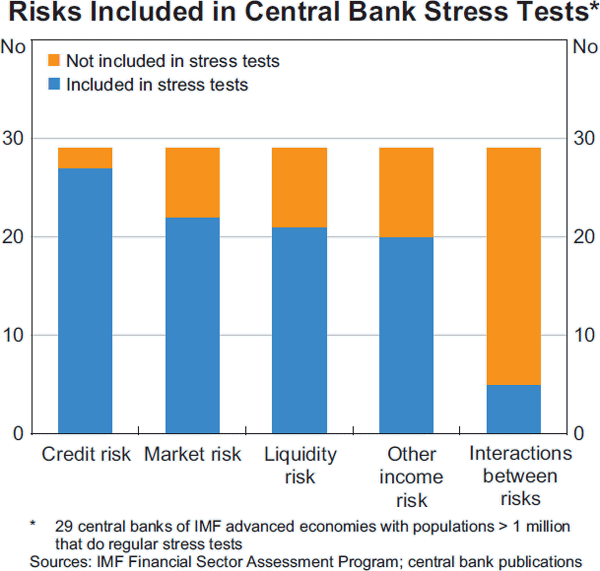
Credit risk is tested by almost all central banks, but coverage of other risks varies (Graph A2). Some central banks cover market risk, while liquidity risk is increasingly being incorporated into stress-testing frameworks.[a2] Risks to the other elements of banks' income, such as net interest income, non-interest income and operating expenses, are covered less frequently. The complexity of the models central banks use also varies: several, such as the Bank of England's Risk Assessment Model for Systemic Institutions (RAMSI), comprehensively model the interactions between different risks (such as credit and liquidity), while others, such as those published by the Sveriges Riksbank in its Financial Stability Report, are largely stand-alone tests of individual risks.
Methodologies also differ within approaches to individual risks, with credit risk a prime example. Most central banks take an econometric approach to modelling credit risk: they use historical data to estimate the relationship between defaults/losses and the economic cycle, and use this relationship to predict losses under stress scenarios. Some, such as the Federal Reserve, estimate models using loan-level data, while others, such as the Bank of England, do their modelling with a small number of aggregated portfolios (corporate, secured household, unsecured household). Corporate bankruptcy and equity price data are used as proxies in jurisdictions where reliable historical default data are not available. The main alternative to historical modelling is simulation using data on individual households and businesses. The Bank of Canada (see Farqui, Liu and Roberts (2012)) employs a model for household credit risk based on a survey of households similar to the HILDA Survey used in the model presented in this article. Norges Bank (see Andersen et al (2008)) uses micro-simulation models for both business and household credit risk, with the latter based on tax return data covering all Norwegian households.
A majority of the central banks that undertake regular stress tests publish the results, generally in their regular financial stability reports. Most results are disclosed at the system level or as a range of bank outcomes. For the supervisory central banks, stress-test results often become an input into assessments of the capital adequacy of supervised institutions; in the case of the Federal Reserve, stress-test results are now the main criteria for the acceptance of a bank's future capital management plan. The Bank of England (2013) has recently proposed a framework for formally incorporating stress testing into its assessments of systemic risk.
Household Micro-simulation Models
Simulations based on cross-sections of household-level data (household micro-simulations) have become increasingly popular tools for assessing household credit risk. Two typical approaches to household micro-simulations are the ‘financial margin’ and the ‘threshold’ approaches. Under the former approach, each household is assigned a financial margin, usually the difference between each household's income and minimum expenses (including debt-servicing expenses).[3] Households with negative financial margins are presumed to default on their debts. Combining this information with household assets and debt allows expected defaults and loan losses to be estimated, at both the individual household and aggregate levels. Shocks to macroeconomic variables can then be applied to estimate their impact on expected defaults and loan losses. Alternatively, the ‘threshold’ approach assumes that each household defaults when a certain threshold is breached – for example, when total debt-servicing costs exceed 40 per cent of income.[4] While this method requires fewer assumptions than the financial margin approach, it may be inappropriate to assume that all households with high debt-servicing costs will default. Indeed, higher-income households are more likely to be able to bear higher debt-servicing ratios than lower-income households. The model in this article is based on a financial margin approach and shares many features in common with a model based on Austrian households by Albacete and Fessler (2010).
Methodology
Most variables in the simulation are from the HILDA Survey. This is a nationally representative panel survey of household characteristics and finances that has been collected annually since 2001. Special modules providing additional information on household wealth are available at four-year intervals (2002, 2006 and 2010), and this information is used extensively in the simulation.
The steps involved in the simulation are as follows (Figure 1):[5]
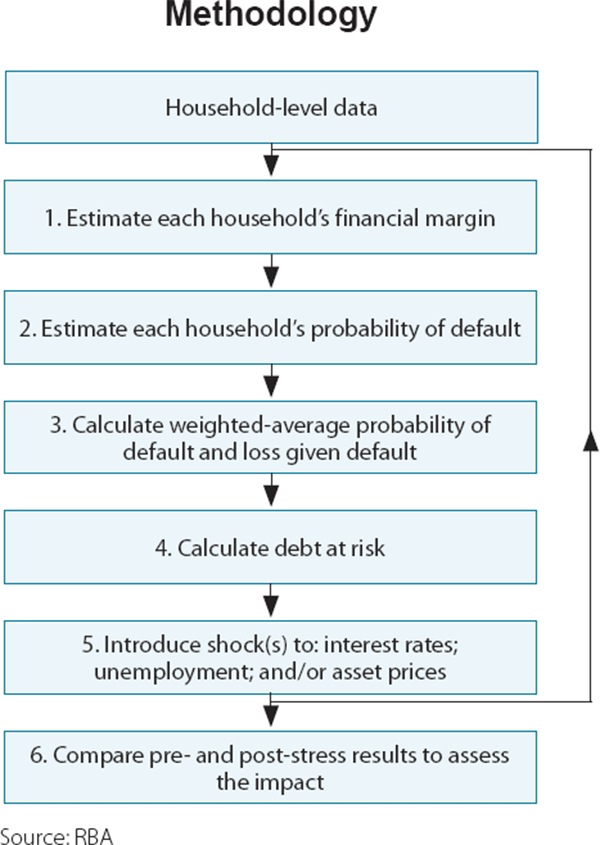
This figure displays all the steps that are explained in the methodology.
- Initially, a pre-stress baseline is established. For each household, a financial margin is calculated as disposable income less rental payments, estimated minimum consumption expenditure and estimated minimum debt-servicing costs on all debt owed to financial institutions.[6]
- Households with financial margins below zero are assigned a probability of default (PD) of one, and other households a PD of zero. For the purposes of the model, households with negative financial margins are expected to default in the period under consideration.
- Each household's PD is combined with its assets and debt enabling the calculation of total household sector weighted-average PD and loss given default (LGD) rates. The weighted-average PD is the proportion of total household debt held by households expected to default. The weighted-average LGD is the share of debt in default that is not covered by collateral.
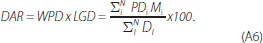
- The debt-at-risk rate is a measure of expected household loan losses as a proportion of household loans (calculated as the product of the weighted-average PD and LGD rates). Debt at risk can be analysed as total household debt or separated into its components of housing debt, credit card debt and other personal debt.
- Once pre-stress results are established, macroeconomic shocks – to interest rates, the unemployment rate and asset prices – can be applied individually or in combination. The interest rate shock raises households' debt-servicing burden. The unemployment rate shock lowers income for affected households by reducing the income of individuals that become unemployed to an estimate of the unemployment benefits for which they would qualify. Each individual's probability of becoming unemployed depends on their characteristics. A Monte Carlo simulation with 1,000 trials is used and results are presented as the average value from these trials.[7] The asset price shock reduces collateral values, and thus raises LGDs, but does not affect PDs.[8]
- The impact of the stress scenario is assessed as the difference between the pre- and post-stress share of households with negative financial margins and debt-at-risk rates. The difference between pre- and post-stress debt-at-risk rates can, for example, be scaled by bank capital in order to evaluate the banking system's exposure to shocks.
The process is repeated for the 2002, 2006 and 2010 surveys. The model does not have a time dimension, to the extent that everything takes place during the one period under consideration. In effect, applied shocks and default occur instantly. As a result, weighted-average PD, LGD and debt-at-risk rates (and other outputs of the model) cannot be interpreted as stemming from real-world shocks, such as high unemployment lasting a number of periods.
Pre-stress Results
Reviewing the output of the simulation before applying shocks gives a measure of household financial resilience and banks' exposure over the 2000s. The share of households with negative financial margins declined from around 12 per cent in 2002 to 8½ per cent in 2010, despite similar interest rates in each period (Graph 1, left panel). This difference largely reflects the strong growth of real household disposable income over this period, which eased the burden of basic expenses and debt repayments. Most of the households that the model suggests had negative financial margins did not actually default, as many had other assets that they could draw on, and so were actually in sound financial positions.[9] As a reference point, personal bankruptcies and other administrations as a share of the adult population averaged 0.2 per cent per year in the 2000s.
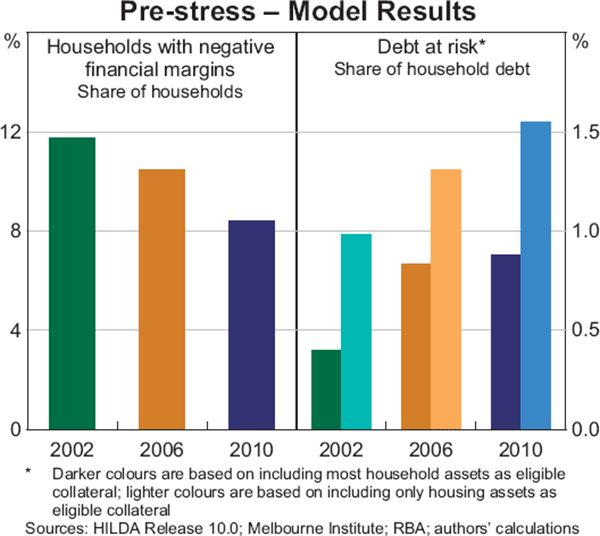
Banks' exposure to households with negative financial margins appears to have been limited, with the aggregate debt at risk as a share of household debt generally staying below 1½ per cent throughout the 2000s (Graph 1, right panel). The size of debt at risk depends on the security for the loan that is assumed to be recoverable by the lender in the event of default: if collateral is defined as just housing assets, the debt-at-risk rate (shown in the lighter shades) is about 0.5 percentage points higher than when collateral is defined as total household assets less non-retirees' superannuation and life insurance assets (shown in darker shades).[10] The debt-at-risk rate rose between the 2002 and 2010 survey years, reflecting increased weighted-average PD and LGD rates. In other words, even though the share of households with negative financial margins fell over this period, on average, these households held a larger share of debt and were less collateralised in each successive survey year.
The rise in expected losses between 2002 and 2010 is primarily driven by credit card and other personal loans (Graph 2). Relatively high expected losses for these types of loans are consistent with their largely unsecured nature; weighted-average LGD rates on credit card and other personal loans reached up to 50 per cent and 25 per cent, respectively. It is important to note though, that credit card and other personal loans only account for about 10 per cent of household debt.
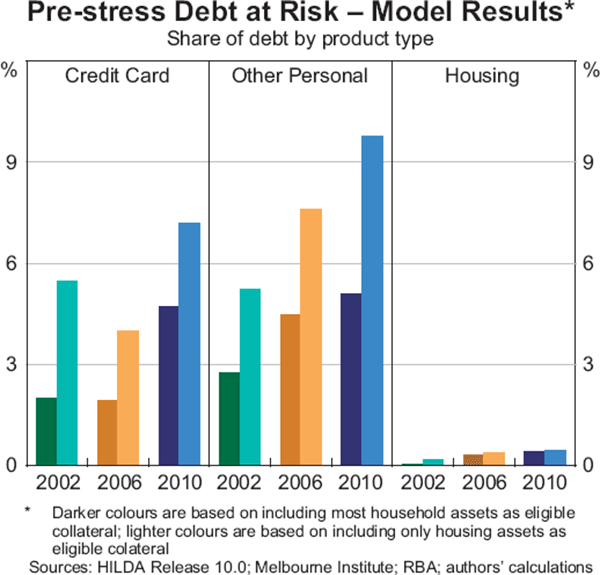
Debt at risk as a share of housing debt was similar in each survey, reaching a maximum 0.5 per cent in 2010. This is an indication of how well-collateralised housing loans tend to be in Australia, particularly for primary mortgages on homes, where the weighted-average LGD rate is estimated to be close to zero in each survey year. Indeed, around 4.5 per cent of owner-occupier mortgagors reported having housing loans larger than the self-assessed value of their property in the 2000s and less than 15 per cent had estimated housing loan-to-valuation ratios (LVRs) above 80 per cent. This high level of collateralisation among mortgagors is partly related to the strong growth in housing prices through the 1990s and early 2000s, but also reflects the tendency for Australian households to prepay their mortgages (for example, see RBA (2012)).
The relative levels of losses by product type modelled for 2010 compare well with the relative levels of actual product type losses experienced by three of the four major banks over the same period (one major bank does not publish comparable data). Annualised net write-off rates reported by these major banks averaged 3 per cent over 2010 to 2012 for both credit card and other personal lending, while the annualised net write-off rate on housing lending was much lower, at 0.04 per cent. However, the total values of modelled losses for each product type in 2010 exceed reported (annual) levels substantially. This is unsurprising and may partly reflect the simple nature of the model: in contrast to the default assumption in the model, households with negative financial margins may be able to avoid default by drawing down on liquid asset reserves, selling other assets or securing new employment (and income) within the household.
Sensitivity Analysis
Applying each macroeconomic shock in isolation gives a sense of its differing effect on household credit risk in the model, although these shocks would not typically occur in isolation in a real-world scenario.[11] Table 1 presents the estimated impact – the change relative to the pre-stress results – for 2010, and results for other years are similar:
| Isolated shocks to: | |||
|---|---|---|---|
| Interest rates | Unemployment rate | Asset prices | |
| 1 percentage point rise | 1 percentage point rise | 10 per cent fall | |
| Share of households with negative financial margins | 0.6 | 0.3 | na |
| Debt-at-risk rate: | |||
| Using household assets | 0.1 | * | 0.3 |
| Using housing assets | 0.2 | * | 0.4 |
|
* Small positive effect Sources: HILDA Release 10.0; Melbourne Institute; RBA; authors' calculations |
|||
- Interest rate shock: a 1 percentage point rise in interest rates for all types of borrowing causes the share of households with negative financial margins to rise by 0.6 percentage points, because of the rise in these households' debt-servicing costs. It has a limited impact on the debt-at-risk rate (up by a maximum of 0.2 percentage points) since households whose financial margins are reduced below zero by the shock tend to be well collateralised. That is, the households whose debt-servicing burdens increase the most tend to have lower LVRs.
- Unemployment rate shock: a 1 percentage point increase in the unemployment rate causes the share of households with negative financial margins to rise by 0.3 percentage points, but has little effect on the debt-at-risk rate. The limited impact on debt at risk largely reflects the strong financial position of most Australian households. In addition, it is also influenced by the smaller amount of debt typically held by the households most likely to become unemployed; each individual's probability of becoming unemployed in the model depends on their characteristics. Some households affected by the unemployment rate shock also already have negative financial margins in the model.
- Asset price shock: a 10 per cent fall in asset prices does not affect household financial margins, but causes the debt-at-risk rate to rise by a maximum of 0.4 percentage points. This occurs because a fall in asset prices in the model causes the value of security that could be claimed by the lender in the event of default to fall, thereby raising the weighted-average LGD rate.
A Stress Scenario
Applying a scenario that incorporates simultaneous shocks to the model gives some insights into household credit risk under more plausible stress situations. To demonstrate this, a hypothetical stress scenario similar to the one described in Laker (2010) is used. In this scenario, a significant deterioration in global economic conditions is assumed to cause an economic downturn in Australia that is worse than that experienced in the early 1990s, and:
- all asset prices fall by 25 per cent;
- the unemployment rate rises by 6 percentage points; and
- there is no reduction in interest rates.
The results should be interpreted as giving an indication of the broad magnitude of the effects of a stress scenario on household financial resilience and how these have changed over the 2000s, taking into account the assumptions made in the model. As noted above, there are many factors that are not considered in the current model, but could be important if the model forms a part of the Bank's more holistic stress-testing framework.
Under the stress scenario, the share of households expected to default rises around 2 percentage points above the pre-stress results (in each survey year; Graph 3), which brings the total shares expected to default to between 10½ and 14 per cent. This increase relative to the pre-stress also rises slightly between each survey year. Similarly, the increase in the debt-at-risk rate is larger in each survey year; the largest increase is about 1½ percentage points in 2010, resulting in a doubling of the household debt-at-risk rate in this year to 3 per cent.
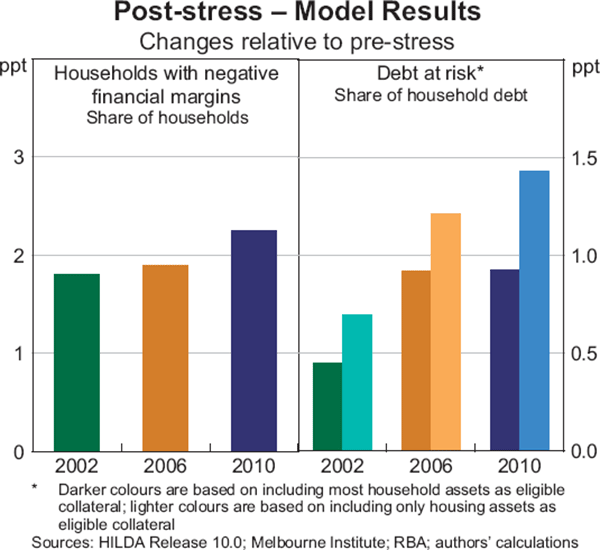
The increased debt at risk under the stress scenario relative to the pre-stress is largely driven by an increase of 8 percentage points in weighted-average LGD rates that flows from the fall in asset prices. Weighted-average PD rates rose by around 2 percentage points in each survey year, a similar sized rise to that in the share of households with negative financial margins reflecting that these newly defaulting households tend to have average levels of debt.
By product type, the rise in the household debt-at-risk rate is largely because of increases in expected losses on credit card and other personal debt, which increase by up to 3 percentage points and 10 percentage points, respectively. By comparison, the estimated increase in the debt-at-risk rate on housing loans is fairly small, largely because of the strong collateralisation of housing loans in Australia, as well as modelling assumptions.[12] Regardless, given housing loans make up a sizeable share of banks' household and total lending, housing loans are an important component of household debt at risk.
The results from the stress scenario suggest that households were quite resilient during the 2000s and were well placed to withstand a shock to economic conditions. The next step in the stress-testing framework would be to compare the results with bank capital to understand the flow-on effects to the banking sector. Rough calculations suggest that the losses implied from this model account for a small, but non-trivial, amount of banking system capital, although this analysis can be more appropriately undertaken once further refinements to the model are made.
Limitations of the Model
As with all stress-testing models, the simulations described in this article have some limitations that are critical to their interpretation:
- The one period nature of the model means that the results can only provide a broad indication of the magnitude of the effect of an economic shock. For example, a 6 percentage point increase in the unemployment rate in the model means that 6 per cent of individuals in the labour force (on top of those already unemployed) become unemployed in that period. Within this extra 6 per cent, any household whose financial margin falls below zero is assumed to default within the same period. By contrast, in a real-world downturn involving many periods of high unemployment, a certain proportion of the individuals that become unemployed would find jobs prior to defaulting.
- Calculating financial margins requires assumptions about minimum consumption, interest rates and loan terms, which may not be appropriate for all households. For example, minimum consumption estimates in the model are obtained from the HPL, which is not adjusted for the household's location or their income.
- Household surveys may not be ideal to capture household financial resilience. This is because households tend to overstate their self-assessed housing values, and understate their debt and income.[13] Although efforts are made to ensure that the HILDA Survey sample is representative, households with precarious finances often do not disclose their financial position, while higher-income households are less likely to remain in the sample over time.
- Household micro-simulations are relatively untested in actually capturing and predicting stress. While these models have been developed in a number of countries, none of these countries have had crises that emanated from the household sector.[14]
Potential Future Work
There are a number of advancements that could be made to the model, including:
- Adding an explicit time dimension and allowing for other more complex behaviours would allow more realistic scenarios to be incorporated into the model, including downturns over multiple years. For example, in the current model, households with negative financial margins are assumed to default regardless of their asset position. However, it is estimated that around one-third of households with negative financial margins had sufficient liquid assets – including deposits, equities and trusts – to avoid default for at least one year. If households could also sell assets to avoid default, then over three-quarters of households with negative financial margins may be able to avoid default for over a year. This change would be likely to lower modelled losses slightly, but adding other dynamics where shocks are amplified over time could well increase them, so the losses predicted by a more complex model may be larger or smaller than those shown in this article.
- In common with other large household surveys, the HILDA Survey is released 12 to 15 months after the survey is undertaken. By making some basic assumptions, these values could be updated to make inferences about the possible impact of future shocks. The advantage of these forward-looking approaches would be tempered by the additional uncertainty in the data.
Nevertheless, the model provides a useful starting point for developing a holistic stress-testing framework for the Australian banking system. Stress tests based on historical data, including from the early 1990s recession and the global financial crisis, can be used to examine losses arising from business loans or a decline in income more generally. Measuring and modelling liquidity stress is difficult, given that liquidity stress events have been infrequent and often curtailed by public sector intervention. Any such stress tests are likely to be based on judgement and international experiences, but are nonetheless critical given the central role of liquidity in the global financial crisis.
Appendix A
This appendix sets out the technical details of the model used in the simulations in this paper, with each step illustrated in Figure 1. The first step is to calculate the financial margin:
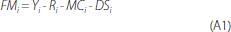
where Y is disposable income, R is rental payments (if any), MC is minimum consumption expenditure, DS is estimated minimum debt-servicing costs (if any) and i denotes each household. All measures are provided on an annual basis or annualised before inclusion. Disposable income and rental payments are self-reported and sourced directly from the HILDA Survey. Minimum consumption information for each household is unavailable in the HILDA Survey, so Henderson Poverty Line (HPL) data, excluding housing costs, are mapped for each household using its characteristics.[15] Minimum debt-servicing costs are estimated as:
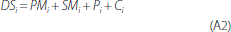
where PM is the estimated minimum primary mortgage repayment, SM is the usual repayment on second mortgages, and P and C are estimated interest payments on personal and credit card debt. Primary mortgage repayments are estimated using a credit-foncier model – a standard financial formula used to estimate mortgage repayments on amortising loans – assuming that all households have a standard variable rate mortgage and a loan tenure of 25 years. The HILDA Survey provides information on usual repayments on primary mortgages but this overstates minimum repayments because around half of Australian households pay more than required on their mortgages. Interest payments on personal and credit card debt are calculated as the multiple of (annualised) current interest rates and the self-reported amounts of each loan outstanding. All interest rates are assumed to be variable.
The second step uses the financial margin to calculate each household's probability of default:
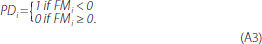
Households with financial margins below zero are assigned a probability of default of one and zero otherwise.
The third step combines households' probabilities of default with household assets and debt, allowing the household sector's weighted-average probability of default and loss given default to be calculated. The weighted-average probability of default is:
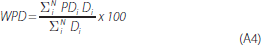
where D is each household's debt, and N is the total number of households.
The weighted-average loss given default is the amount that lenders are likely to be unable to recover on loans in default:
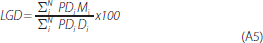
where Mi = Max(Di − Ai, 0) is the dollar value likely to be lost as a result of a household defaulting, and A is the value of a household's eligible collateral. Because there is uncertainty over the collateral or assets lenders would be able to make a claim on, we present upper (where eligible collateral A is assumed to be housing assets) and lower (where eligible collateral A is assumed to be household assets less non-retirees' superannuation and life insurance assets) limits for LGD. The LGD by product type is also affected by loss precedence; losses are assumed to be borne by products in the order of credit cards, other personal loans and mortgages.
The WPD and LGD rates can be combined to estimate the weighted-average debt-at-risk rate; that is, the expected share of loans that will not be recovered by the banking system:
Shocks to interest rates, the unemployment rate and asset prices can then be applied and the process repeated for 2002, 2006 and 2010. The most complex shock, that to the unemployment rate, is modelled through a Monte Carlo simulation with 1,000 trials. The probability of each individual attached to the labour force becoming unemployed is estimated by scaling the results from three separate logit regressions (one for each survey) to match the population-weighted unemployment rate plus the desired shock size.[16] In each trial, every individual is assigned a quasi-random number between zero and one; individuals in the labour force are assumed to become unemployed when this number is less than their probability of becoming unemployed.
Footnotes
The authors are from Financial Stability Department. [*]
A discussion of the different types of stress testing used by financial institutions and prudential supervisors can be found in APRA (2010). [1]
See Laker (2010, 2012) for more information. [2]
For examples of financial margin-type household micro-simulation models, see Johansson and Persson (2007) for Sweden, Andersen et al (2008) for Norway, and Albacete and Fessler (2010) for Austria. These types of models have also been constructed for household sectors in a range of other countries, including Croatia, Finland, Hungary and Latvia. [3]
Threshold-type household micro-simulation models have been built for the household sectors of Canada (Farqui, Liu and Roberts 2012), Chile (Fuenzalida and Ruiz-Tagle 2009) and Korea (Karasulu 2008), among others. [4]
For further details, see Appendix A. [5]
Minimum consumption estimates are taken from the Henderson Poverty Line (HPL). The HPL is designed to be a minimum income level required to avoid a situation of poverty for a range of family sizes and circumstances. Some lenders use this measure of household living expenses in their assessments of loan serviceability for new borrowers. [6]
Monte Carlo simulation is a technique used to approximate the probability of different outcomes by running multiple trials, using quasi-random numbers. [7]
The model does not incorporate second-round effects. For example, a shock to the aggregate unemployment rate is likely to have broader effects on household income than assumed in the model, such as through reduced available hours of work or wages. [8]
This issue is discussed further in the ‘Limitations of the Model’ and ‘Potential Future Work’ sections. [9]
In Australia, residential mortgages are typically full recourse, so lenders have the option of making claims on assets other than the mortgaged property owned by the borrower. In practice, lenders do not always exercise this option. Non-retirees' superannuation assets and life insurance assets are generally protected from creditors in bankruptcy. [10]
In addition, the effect of the individual shocks may be larger or smaller if second-round effects are taken into account. [11]
For example, LGDs on housing loans in the model do not include legal or property possession costs. In addition, falls in housing values are modelled to be the same for all households, whereas evidence suggests that changes in house prices vary considerably across households in actual downturns. For further examples, see the ‘Limitations of the Model’ and ‘Potential Future Work’ sections. [12]
For example, see Watson and Wooden (2004) and Melser (2013). [13]
The US household sector could be a useful case study to test this. Micro-data surveys, such as the Federal Reserve's Survey of Consumer Finances, contain many of the required variables to run such an experiment. [14]
In recent years, many lenders have moved to another measure, the Household Expenditure Measure (HEM), to assess household living expenses. Compared with the HPL, the HEM suggests that living expenses are higher for couples and lower for singles. [15]
The initial variables in each logit model were similar to Buddelmeyer, Lee and Wooden (2009). [16]
Footnotes Box A
This box is based on public information and covers the practices of central banks of IMF advanced economies with populations greater than one million (including both the European Central Bank and national central banks for relevant euro area countries). It does not cover crisis-time stress testing, and stress testing that is required by current prudential standards. [a1]
Market risk is the risk of adverse movements in market prices that require revaluations of banks' assets. Liquidity risk is the risk that a bank will be unable to satisfy its cash flow requirements or will incur losses to do so. [a2]
References
Albacete N and P Fessler (2010), ‘Stress Testing Austrian Households’, Oesterreichische Nationalbank Financial Stability Report No 19, pp 72–91.
Andersen H, T Berge, E Bernhardsen, K Lindquist and B Vatne (2008), ‘A Suite-Of-Models Approach to Stress-testing Financial Stability’, Norges Bank Staff Memo No 2008/2.
APRA (Australian Prudential Regulation Authority) (2010), ‘Stress-testing for Authorised Deposit-taking Institutions’, APRA Insight Issue 2, pp 2–12.
Bank of England (2013), ‘A Framework for Stress Testing the UK Banking System’, A Discussion Paper.
Bilston T and R Johnson (forthcoming), ‘Stress Testing Australian Households Using the HILDA Survey’, RBA Research Discussion Paper.
Buddelmeyer H, W Lee and M Wooden (2009), ‘Low-Paid Employment and Unemployment Dynamics in Australia’, Melbourne Institute Working Paper Series No 6.
Faruqui U, X Liu and T Roberts (2012), ‘An Improved Framework for Assessing the Risks Arising from Elevated Household Debt’, Bank of Canada Financial Stability Review, June, pp 51–57.
Fuenzalida M and J Ruiz-Tagle (2009), ‘Households’ Financial Vulnerability', Central Bank of Chile Working Paper No 540.
IMF (International Monetary Fund) (2006), ‘Australia: Financial System Stability Assessment’, Country Report No 06/372.
IMF (2012), ‘Australia: Financial System Stability Assessment’, Country Report No 12/308.
Johansson M and M Persson (2007), ‘Swedish Households' Indebtedness and Ability to Pay: A Household Level Study’, in Measuring the Financial Position of the Household Sector: Proceedings of 2006 Irving Fisher Committee Conference, Volume 2, Bank for International Settlements, Basel, pp 234–248.
Karasulu M (2008), ‘Stress Testing Household Debt in Korea’, IMF Working paper WP/08/255.
Laker J (2010), ‘The Australian Banking System Under Stress?’, Address to the Australian Business Economists, Sydney, 9 June.
Laker J (2012), ‘The Australian Banking System Under Stress – Again?’, Address to AB+F Leaders, Brisbane, 8 November.
Melser D (2013), ‘How Well Do Australian Home-Owners Know the Value of their Home?’, The Australian Economic Review, 46(1), pp 31–44.
RBA (Reserve Bank of Australia) (2012), ‘Box B: Households' Mortgage Prepayment Buffers’, Financial Stability Review, September, pp 49–50.
Watson N and M Wooden (2004), ‘Assessing the Quality of the HILDA Survey Wave 2 Data’, HILDA Project Technical Paper Series No 5/04.