Bulletin – September 2011 The Australian Semi-government Bond Market
- Download the article 200KB
Abstract
The semi-government bond market has grown rapidly in recent years, reflecting developments in state government financing needs, in particular increasing funding needs for infrastructure investment. The growth has increased the depth and liquidity of the market, and semi-government securities form an important part of the liquid holdings of Australian financial institutions. This article examines the semi-government bond market, highlighting the relationship between the market's development and its current structure.
Introduction
The market for Australian state and territory government debt, commonly referred to as the semi-government bond market, plays an important role in the Australian financial system, enabling state and territory governments to fund their budgets and support infrastructure investment. The market has grown significantly in recent years and has contributed to the development of the fixed-income market in Australia, providing investors with low-risk investments over long maturities and supporting the market for alternative products, such as inflation-linked bonds.
The deepening of the market has also enhanced liquidity, and semi-government securities now form a significant share of the liquid assets of Australia's financial institutions. The demand for semi-government securities is likely to increase over coming years as the introduction of Basel III reforms requires banks to hold higher levels of liquid assets, which include semi-government securities, as well as Commonwealth Government securities (CGS), balances held at the Reserve Bank of Australia and cash.
Against this backdrop, an overview of the semi-government bond market is presented, beginning with an introduction to the market, its size and composition. The article then describes the drivers of the semi-government bond market, and how they have influenced the market's size and characteristics.
Overview of the Market
Queensland Treasury Corporation and New South Wales Treasury Corporation are the largest semi-government issuers, together representing around two-thirds of the market (Table 1). At the other end of the spectrum, Tasmanian Public Finance Authority, Northern Territory Treasury Corporation and Australian Capital Territory Department of Treasury together represent less than 5 per cent of outstanding semi-government debt. Because Australian treasury corporations are explicitly guaranteed by their respective state governments, treasury corporations' ratings reflect those of their state governments – currently either AAA or AA+.
| Long-term | Short-term | |||||
|---|---|---|---|---|---|---|
| State/ Territory |
Onshore $billion |
Offshore $billion |
Onshore $billion |
Offshore $billion |
Total $billion |
Credit rating(a) |
| Qld | 63.8 | 2.7 | 2.9 | 1.8 | 71.1 | AA+ |
| NSW | 44.7 | 6.2 | 1.9 | 1.7 | 54.5 | AAA |
| Vic | 24.8 | 0.7 | 0.3 | 1.9 | 27.7 | AAA |
| WA | 19.4 | 0.0 | 3.4 | 3.2 | 26.0 | AAA |
| SA | 8.5 | 0.3 | 1.4 | 1.1 | 11.2 | AAA |
| Tas | 2.2 | 0.0 | 1.9 | 1.6 | 5.7 | AA+ |
| NT | 2.7 | 0.0 | 0.1 | 0.0 | 2.8 | AA+ |
| ACT | 1.2 | 0.0 | 0.3 | 0.0 | 1.5 | AAA |
| Total | 167.3 | 9.8 | 12.0 | 11.4 | 200.5 | |
|
(a) Standard & Poor's rates all Australian states and territories, except the Northern Territory which is rated equivalent to AA+ by Moody's Source: state and territory treasury corporations |
||||||
The bulk of issuance in the semi-government market has been long-term debt securities issued into the domestic market with an original term-to-maturity of greater than one year. Long-term debt is largely comprised of ‘benchmark’ bonds – generally liquid bonds where the issuing state treasury corporation commits to maintaining a minimum amount outstanding in the bond at any given time.[1] By value, benchmark bonds account for at least 85 per cent of total issuance for all states and territories, except the ACT. The amount of any given bond has also been increasing in recent years; the average issue size of fixed-rate bonds has increased 50 per cent since 2005. This has contributed to the liquidity of the semi-government bond market, as larger issues are typically easier to trade.
Treasury corporations also issue short-term securities to assist in the management of their cash flows. These short-term borrowings are in the form of domestic notes and foreign commercial paper programs. They allow the treasury corporations to smooth their cash flow needs, particularly when large bond maturities fall due. As at June 2011, there were $12.0 billion in domestic semi-government notes outstanding, consisting primarily of securities issued by Western Australian Treasury Corporation, Queensland Treasury Corporation, New South Wales Treasury Corporation and Tasmanian Public Financing Authority.[2]
Drivers of Issuance
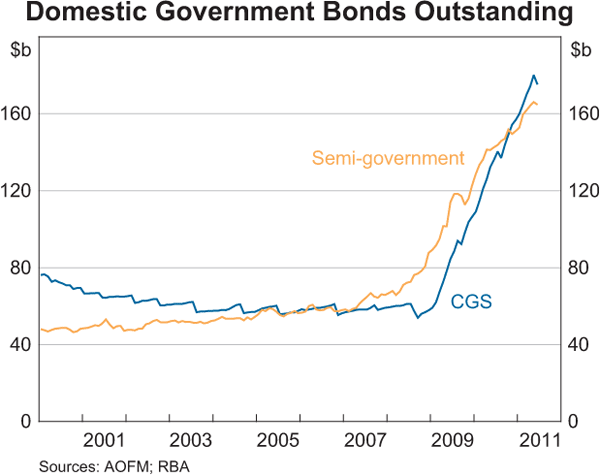
The semi-government bond market has grown rapidly in recent years, and is now broadly similar in size to the CGS market. As at June 2011, there were around $167 billion in semi-government bonds outstanding, representing an increase of around $110 billion since the beginning of 2005 (Graph 1).
Around two-thirds of outstanding semi-government bonds were issued to fund capital expenditure by government-owned corporations, commonly referred to as Public Trading Enterprises (PTEs). These corporations provide essential services to the community, primarily through the development of state infrastructure assets. Australian treasury corporations had around $100 billion in on-lending outstanding to PTEs as at June 2010. The bulk of the remainder of outstanding bonds have funded state and territory government budgets, with a minority of states also borrowing on behalf of local governments.
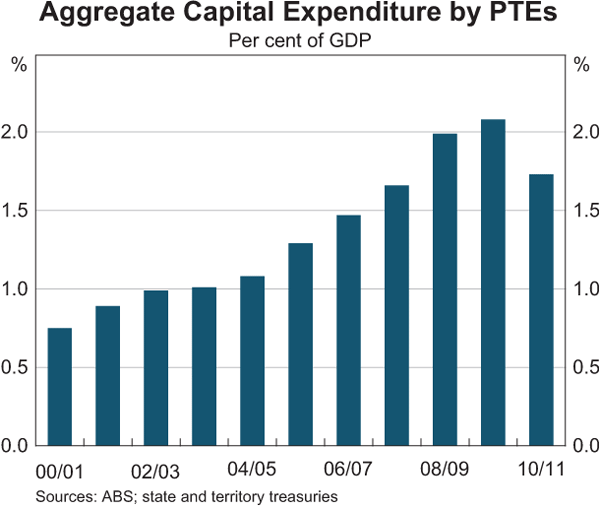
Aggregate capital expenditure by PTEs has grown steadily since 2000 with total expenditure peaking at over 2 per cent of GDP in the 2010 financial year (Graph 2). State government stimulus programs resulted in particularly strong infrastructure spending in the 2009 and 2010 financial years as investment programs were brought forward. This led to robust growth in the semi-government market as treasury corporations funded this stimulus. As these programs are completed, aggregate capital expenditure by PTEs is expected to decline, although the state and territory treasuries still forecast strong capital expenditure by PTEs in coming years.
The electricity sector is the largest recipient of funding from state treasury corporations. New South Wales Treasury Corporation and Queensland Treasury Corporation had total loans outstanding to the electricity sector amounting to $17.1 billion and $13.7 billion, respectively, as at June 2010 (Graph 3). Victoria, on the other hand, did not have loans outstanding to the electricity sector, having reduced the public-sector funding burden through privatisation of electricity assets in the 1990s. In recent years, other state governments have also sought to reduce the size of their balance sheets and promote infrastructure investment by the private sector by privatising electricity assets. Nevertheless, most state governments still own electricity assets, the maintenance and expansion of which will ensure continuity of demand for state treasury corporations' funding services.
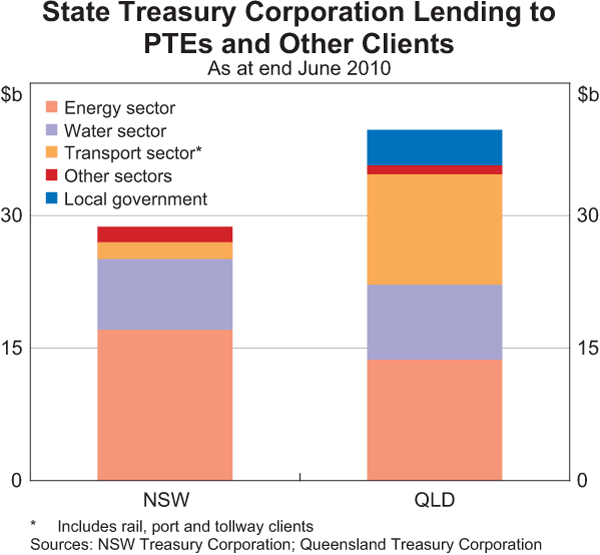
Other major clients of treasury corporations include water and transport sector PTEs. Queensland Treasury Corporation had $12.5 billion in outstanding loans to the transport sector as at June 2010, primarily for the development of road and rail infrastructure. For other states, such as New South Wales, public funding of transport infrastructure has mainly occurred directly through state treasuries.
Structure of the Market
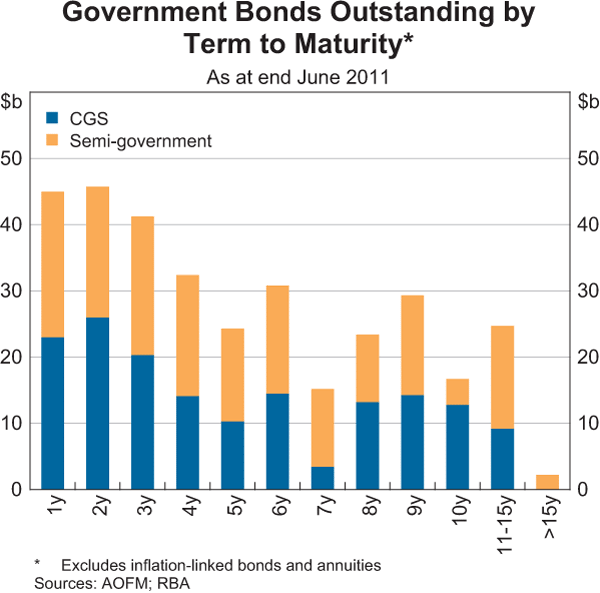
The long operating lives of PTEs' infrastructure assets mean that treasury corporations have actively sought to extend the maturity profile of their debt. State treasury corporations seek to borrow at the longest maturities possible, with the maturity profile of the CGS market generally constraining issuance at longer tenors. CGS provides primary pricing for the domestic yield curve, and hence it is difficult for semi-government bonds to be issued at longer maturities than CGS; the longest tenor of a nominal CGS is currently 12 years. The weighted average term to maturity of the semi-government market is slightly longer than that of the CGS market – 5.5 years compared to 5.0 years. Around 11 per cent of the semi-government market comprises bonds with maturities greater than 10 years, compared to 6 per cent for the CGS market (Graph 4).
State treasury corporations fund themselves almost entirely in the domestic market, with domestic bonds constituting over 90 per cent of the outstanding stock of semi-government bonds (Graph 5). In the past, bonds issued offshore through ‘global exchangeable bond’ programs provided some foreign investors with tax benefits.[3] However, following tax changes in December 2008, state treasury corporations are no longer issuing global exchangeable bonds and have instead actively sought to repurchase outstanding stock of these securities. This has led to a decline in the outstanding stock of global exchangeable bonds in recent years.
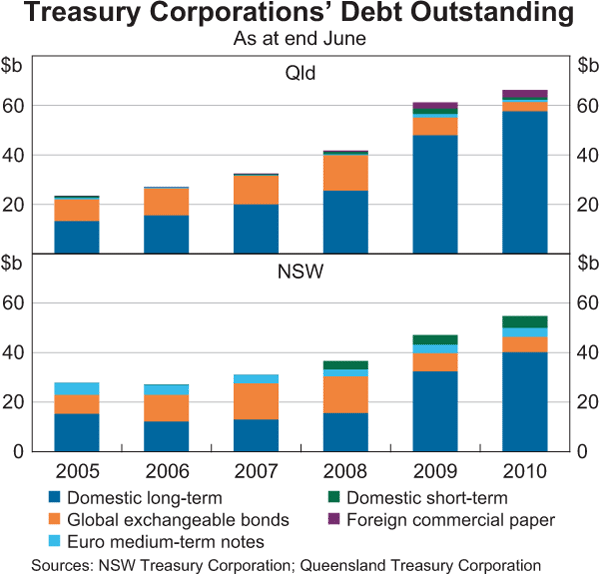
The largest treasury corporations issue some foreign currency bonds using euro medium-term note programs, although foreign currency funding represents only a small proportion of their total capital market borrowings. For example, New South Wales Treasury Corporation had $3.5 billion in euro medium-term notes outstanding as at June 2010. Because PTEs do not require funding in foreign currencies, state treasury corporations use derivatives to ensure that foreign currency denominated borrowing is hedged into Australian dollars.
State treasury corporations also issue inflation-linked bonds to meet demand from PTEs for inflation-linked borrowing. These PTEs, mostly utilities and infrastructure companies, favour inflation-linked bonds because of the sensitivity of their revenue to inflation over the long term and the ability to attract investors at longer maturities. Insurers, superannuation funds and mutual funds are natural investors for inflation-linked bonds, because they offer long-dated maturities and provide a hedge against inflation. New South Wales Treasury Corporation has been particularly active in tailoring issuance to investor demand, with significant inflation-linked issuance in both 2009 and 2010. As at June 2011, there were around $7 billion of semi-government inflation-linked bonds outstanding, compared with $14 billion of inflation-linked CGS.
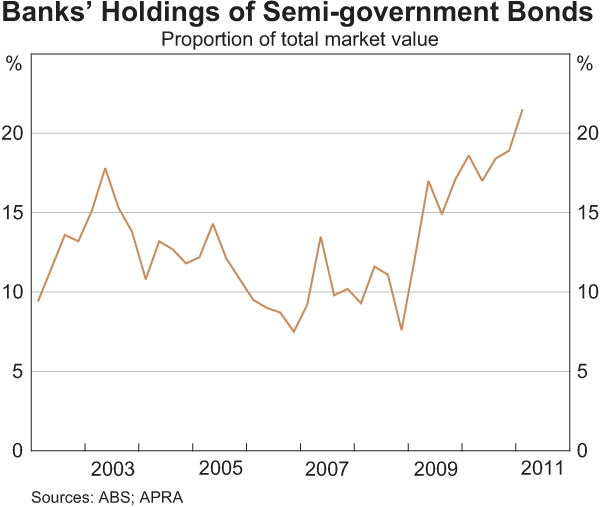
As noted previously, demand from investors holding semi-government securities for liquidity purposes has also supported issuance by state treasury corporations. By market value, Australian banks are the largest domestic investors in semi-government securities, holding around 21 per cent of the outstanding stock of semi-government bonds in March 2011 (Graph 6). State treasury corporations also hold other states' semi-government bonds for liquidity management purposes.
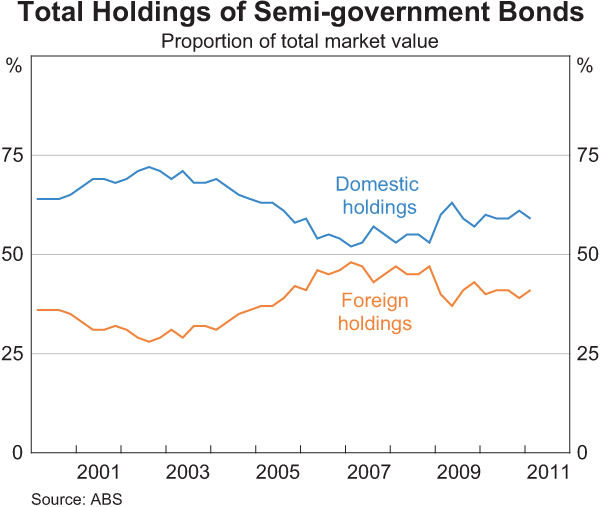
Domestic investors, particularly banks, have increased their share of semi-government bonds since the onset of the financial crisis. Domestic investors now hold around 60 per cent of the market value of semi-government bonds outstanding, up from 53 per cent in June 2007 (Graph 7). This compares with current domestic holdings of around 30 per cent of CGS outstanding.
Pricing of Semi-government Securities
Explicit backing by their respective state governments has meant investors generally perceive credit risk for state treasury corporations to be low. This has typically resulted in semi-government bonds trading at tight spreads to CGS (Graph 8). Nevertheless, during periods of market distress, semi-government bond spreads generally widen, as investors seek to hold more of the safest and most liquid securities – namely CGS. During the period of market dislocation following mid 2007, the spread between the yields of semi-government securities and CGS widened to over 120 basis points, up from around 25 basis points before the crisis. Although currently well below their peaks in late 2008, recent market uncertainty has caused spreads to rise in recent months. The increase in spreads during periods of heightened risk aversion may in part reflect the fact that some investors, particularly offshore investors, are not always familiar with the extent of vertical fiscal integration in Australia, whereby state governments receive a large share of their revenue via redistributions of Australian Government tax receipts.
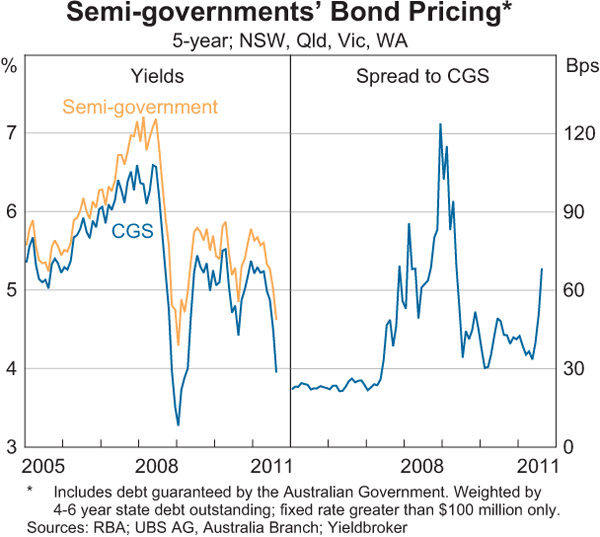
The Australian Government announced in March 2009 that it would establish a guarantee scheme for state and territory borrowings. It provided support to the states during the financial crisis when debt issuance was very challenging for non-sovereign borrowers. The guarantee scheme allowed treasury corporations to opt in voluntarily to guarantee any new or existing Australian dollar treasury corporation debt for a fee paid to the Australian Government. The two largest issuers of semi-government securities – Queensland and New South Wales – were the two states that decided to use the government guarantee, which was closed to new issuance on 31 December 2010.
Borrowing conditions have improved since the financial crisis with spreads retracing most of the widening that occurred over that period. As unguaranteed debt became less costly to issue than guaranteed debt, Queensland Treasury Corporation and New South Wales Treasury Corporation actively sought to reduce their guaranteed debt outstanding through buybacks and switches. Currently, around 35 per cent of Queensland Treasury Corporation's and New South Wales Treasury Corporation's long-term debt is guaranteed by the Australian Government.
Summary
State and territory treasury corporations provide funding services, both to finance infrastructure development and to support the operating position of state and territory governments. In response to an increase in demand for funding, the semi-government bond market has grown rapidly in recent years, with the market now similar in size to the Commonwealth Government bond market. The vast majority of semi-government issuance takes place in the domestic market through long-term benchmark issues where minimum outstanding amounts are maintained to promote liquidity. Upcoming Basel III liquidity reforms will mean that semi-government securities are likely to continue to be an important feature of the balance sheets of Australian banks.
Footnotes
The authors are from Domestic Markets Department. [*]
The precise definition varies by state. For example, Victoria commits to maintaining benchmark bond lines at $2.5 billion to $3 billion, whereas the Northern Territory has ‘institutional lines’ with between $300 million and $500 million on issue. [1]
For more information on short-term securities, see Boge and Wilson (2011). [2]
Global exchangeable bonds are Australian dollar-denominated bonds issued overseas that are exchangeable for an equivalent domestic bond at the holder's option. They were a popular means of ensuring that interest withholding tax was not paid unnecessarily. [3]
Reference
Boge M and I Wilson (2011), ‘The Domestic Market for Short-term Debt Securities’, RBA Bulletin, September, pp 39–48.