Bulletin – December 2011 Business Surveys and Economic Activity
- Download the article 892KB
Abstract
The Reserve Bank makes extensive use of business surveys as a source of information on the current state of the economy. In particular, survey data provide a timely read on domestic demand as well as information about how the economy is expected to evolve. Surveys also provide information on aspects of the economy that are difficult to capture using official statistics. It is important, however, to interpret survey information with care, being mindful of the influence of survey design.
Introduction
There are numerous Australian private business surveys in which companies are asked a range of largely qualitative questions about conditions in their own business and the broader economy. This article provides an overview of the main business surveys in Australia and discusses how the surveys can be used. These surveys provide timely information about the current state of the economy, via questions on sales, profits, hiring and prices.[1] In addition, they provide indicators of sentiment and expectations, as well as details on plans for hiring and capital spending. Business surveys also provide coverage of sectors for which official data are less frequent and provide insights into issues such as capacity utilisation and access to finance.
Private Sector Business Surveys in Australia
Table 1 summarises the features of eight business surveys that measure nationwide economic activity which are regularly monitored by the Bank.[2] Coverage differs across surveys: some cover just a few sectors, while others aim to cover the entire private sector, though the volatile farm and/or mining sectors are often excluded or under-represented. The surveys attempt to measure nationwide conditions, either using representative samples, or weighting firms' responses according to their industry, with weights based on output or the number of businesses. For some sectors, notably the mining sector, this latter choice is very important; for example, matching the ABS count of Australian businesses would place a weight of less than 1 per cent on the mining sector, whereas mining accounted for around 9½ per cent of gross value added in 2010/11.
| Frequency | Sample size (approx) | Coverage | Commenced | |||
|---|---|---|---|---|---|---|
|
ACCI Business Expectations Survey |
Quarterly | 2,000 | All major sectors (includes farm and mining) |
Nov 1994 | ||
| ACCI-Westpac Survey of Industrial Trends | Quarterly | 200–300 | Manufacturing | Sep 1961 | ||
| AIG-PwC Performance of Manufacturing Index | Quarterly/ Monthly |
900/ 200 |
Manufacturing | Sep 1992/ May 2001 |
||
| AIG-HIA Performance of Construction Index | Monthly | 150 | Construction | Sep 2005 | ||
| AIG-CBA Performance of Services Index | Monthly | 200 | Services | Feb 2003 | ||
| Dun & Bradstreet National Business Expectations Survey | Monthly | 1,200 | Manufacturing, retail and wholesale |
Dec 1987 | ||
| NAB Quarterly Business Survey / NAB Monthly Business Survey | Quarterly/ Monthly |
900/ 400–500 |
Non-farm sector | Sep 1989/ Mar 1997 |
||
| Sensis Business Index | Quarterly | 1,800 | Small and medium firms in most major sectors (excludes farm and mining sectors) | Aug 1993 | ||
|
Sources: ACCI; AIG; CBA; Dun & Bradstreet; HIA; NAB; PwC; Sensis; Westpac |
||||||
Most of the surveys monitored by the Bank provide information on current business conditions, including information on sales, profitability, employment, capital expenditure and selling prices. Some also provide forward-looking information, and information on capacity utilisation, new orders, input costs, inventories and exports. There is typically some variation in the way questions are phrased. Firms may be asked about the change in a variable over time or the level of a variable relative to normal. Some surveys ask respondents to abstract from normal seasonal changes, while others make a comparison with the corresponding period a year ago; for other surveys, indices are seasonally adjusted.
Surveys as Timely Indicators of Economic Activity
Many business surveys include questions on variables such as sales, employment and prices, which can be used to provide a timely read on current economic conditions and are released in advance of comparable official statistics. Monthly surveys of business conditions are available as early as the first week of the following month, and quarterly surveys are typically available within four weeks of the end of the quarter. In contrast, national accounts data on GDP growth are not released until around nine weeks after the end of the quarter.
Most surveys include measures of current business conditions, often aggregated from questions about variables such as current sales, profitability and employment. Since these survey measures have different average levels and variances, the Bank often presents these in standardised form, adjusted to have a common mean and standard deviation. On this basis, the different survey measures tend to move broadly in line with one another (Graph 1) despite differences in both the nature of questions and the coverage of surveys. Moreover, when plotted against quarterly growth in trend GDP published by the ABS, the weighted average of the selected survey measures captures the major cyclical movements in GDP, including the early 1990s recession and the downturns in 2000/01 and 2008/09.
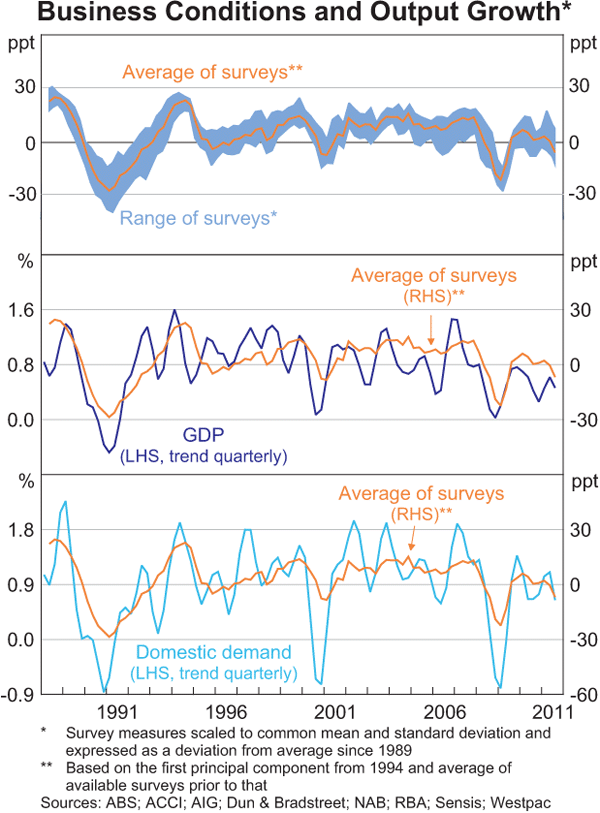
Survey-based measures of business conditions tend to be considerably less volatile than estimates of both seasonally adjusted and trend growth in GDP. While industry-specific developments can have a pronounced effect on GDP growth in a particular quarter, survey measures appear to be less affected by such developments. The divergence between survey measures of business conditions and trend GDP in early 2011 provides an example. During that period, GDP growth fell sharply, driven by a significant fall in coal and iron ore exports, while survey measures – which often exclude or place less weight on mining firms – remained around average levels.
Notwithstanding the volatility in quarterly estimates of trend GDP growth, the correlation coefficients between survey-based measures of business conditions and GDP growth are generally positive at around 0.4 for the survey average since 1994, and around 0.5 for the NAB Quarterly Business Survey which commenced in 1989 (Table 2). The correlation between business surveys and domestic demand growth tends to be noticeably higher at 0.7. This suggests that responses to questions about businesses' sales, profitability and employment are more closely aligned to domestic spending than to domestic production as measured by GDP. This partly reflects the fact that most surveys either exclude or underweight (in terms of their share of output) the volatile farm and mining sectors.
| Survey average(a) | NAB Quarterly Business Survey |
|||||
|---|---|---|---|---|---|---|
| Start of sample period | September 1994 | September 1989 | ||||
| Contemporaneous correlation between survey measure and quarterly growth |
||||||
| Trend real GDP | 0.36 | 0.48 | ||||
| Trend real domestic demand | 0.71 | 0.67 | ||||
| Trend nominal domestic demand | 0.74 | 0.72 | ||||
| Explanatory power in an autoregressive
model of quarterly growth (adjusted R2)(b) |
||||||
| Seasonally adjusted real GDP | ||||||
| Baseline model (lags of GDP growth) |
0.00 | 0.01 | ||||
| Including survey variable | 0.04 | 0.09 | ||||
| Seasonally adjusted real domestic demand | ||||||
| Baseline model (lags of domestic demand growth) | 0.06 | 0.06 | ||||
| Including survey variable | 0.33 | 0.25 | ||||
| Seasonally adjusted nominal domestic demand | ||||||
| Baseline model (lags of domestic demand growth) | 0.02 | 0.02 | ||||
| Including survey variable | 0.36 | 0.34 | ||||
|
(a) The survey average is based on the first principal component of general
business conditions from the ACCI Business Expectations Survey, the composite
index of actual activity from the ACCI-Westpac Survey of Industrial Trends,
the AIG-PwC Performance of Manufacturing Index, the average of actual
sales, employees and profits from the Dun & Bradstreet National Business
Expectations Survey, actual business conditions index from the NAB Quarterly
Business Survey and the average of sales, profits and employment from
the Sensis Business Index
Sources: ABS; ACCI; AIG; Dun & Bradstreet; NAB; PwC; RBA; Sensis; Westpac |
||||||

Interestingly, measures of business conditions are also slightly more correlated with growth in nominal domestic demand than real domestic demand. This is consistent with research in the United Kingdom for the Confederation of British Industry (CBI), which showed that around two-thirds of firms typically use revenues as a proxy for volumes when answering questions about the volume of output.
A test of whether survey measures of business confidence provide information about growth in output can be conducted by adding survey measures to simple autoregressive models of quarterly growth in GDP and domestic demand.[3] The results of these tests show that the business surveys contain useful information about quarterly GDP growth (seasonally adjusted), although the information content is relatively small. These results partly reflect the inevitable noise in quarterly estimates of GDP, which in part comes from developments in the farm and mining sectors. Once again, the information content in surveys regarding quarterly growth in both real and nominal domestic demand is significantly larger than for GDP. This confirms that surveys are better viewed as providing timely information about domestic demand rather than GDP.
Surveys as Forward-looking Indicators of Economic Activity
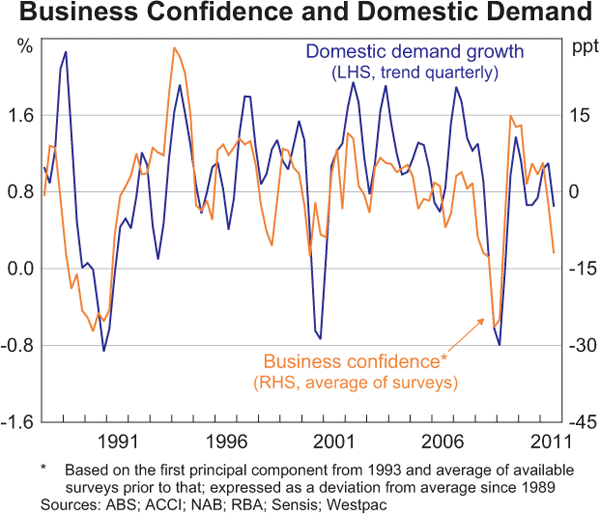
Business confidence
Many surveys include questions about businesses' expectations of future conditions in their industry and/or the economy as a whole, referred to here as ‘business confidence’. If businesses revise down their expectations of future conditions, then they are also likely to revise down production plans, scale back planned investment or hire less labour, leading to lower output growth. As shown in Graph 2, survey measures of business confidence move broadly in line with quarterly domestic demand growth, particularly in periods where there are very large swings in output, such as the early 1990s recession and the 2009 downturn.[4] In a similar fashion to measures of business conditions, business confidence measures contain some information on near-term demand growth.
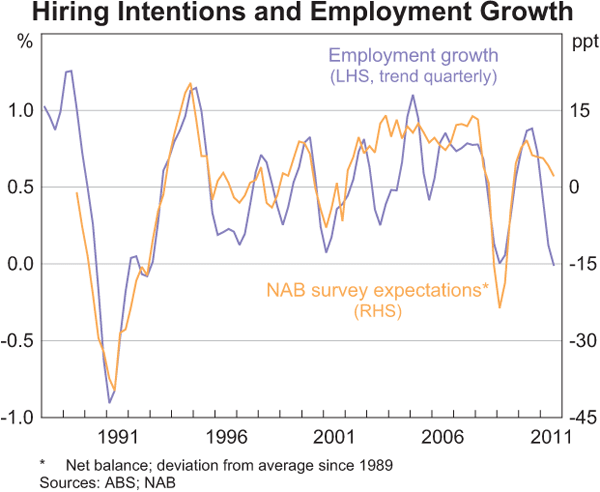
Hiring intentions
Several business surveys provide a timely source of information on firms' hiring intentions, such as questions on whether firms expect employment levels to increase or decrease in the forthcoming quarter. As shown in Graph 3, survey measures of hiring intentions have generally been highly correlated with movements in employment growth, with correlation coefficients for hiring intentions and trend quarterly employment growth generally around 0.7 to 0.9 (Table 3). As for business confidence, these questions are forward-looking, and for most measures there is also a strong positive correlation with employment growth in the subsequent period. Survey measures of hiring intentions can also be used to inform forecasts of employment growth: adding survey variables to simple models of employment growth increases the explanatory power of these models considerably, both for the current quarter and the next quarter.
| Survey average(a) | NAB Quarterly Business Survey |
|||||
|---|---|---|---|---|---|---|
| Start of sample period | June 1993 | September 1989 | ||||
| Correlation between survey measure and trend quarterly employment growth |
||||||
| Current quarter | 0.71 | 0.85 | ||||
| Next quarter | 0.65 | 0.86 | ||||
| Explanatory power in an autoregressive
model of quarterly growth (adjusted R2) |
||||||
| Current period employment growth(b) | ||||||
| Baseline model (lags of employment growth) | 0.20 | 0.35 | ||||
| Including survey variable | 0.33 | 0.51 | ||||
| Next period employment growth(c) | ||||||
| Baseline model (lags of employment growth) | 0.04 | 0.19 | ||||
| Including survey variable | 0.34 | 0.50 | ||||
|
(a) The survey average is based on the first principal component for: expected
employment or hiring series from the NAB Quarterly Business Survey, the
ACCI-Westpac Survey of Industrial Trends and the Sensis Business Index
Sources: ABS; ACCI; NAB; RBA; Sensis; Westpac |
||||||


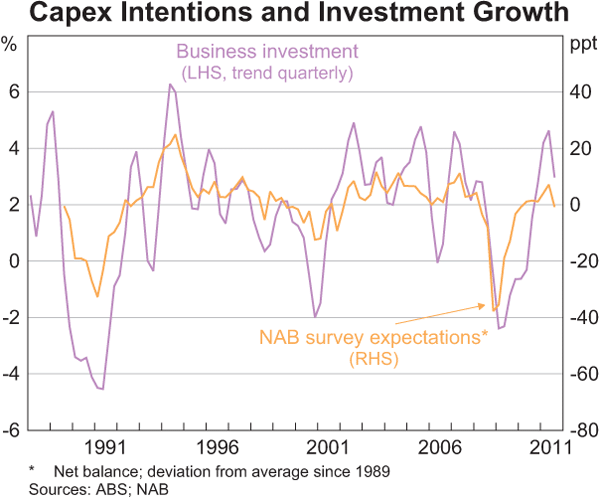
Capital spending plans
Several surveys also provide a timely source of information on whether firms are planning to increase or decrease their investment spending in the near term. For example, participants in the NAB, ACCI-Westpac and Sensis surveys are asked what they expect to happen to capital expenditure (capex) over the next 12 months, while the Sensis, Dun & Bradstreet and AIG surveys focus on firms' capex at shorter horizons. Correlation coefficients for investment intentions and trend quarterly investment growth are generally positive and range from 0.7 to 0.8, indicating that there is a strong positive association between the two variables (Table 4; Graph 4). Statistical tests also indicate that these investment intentions provide some information about actual changes in investment: the explanatory power of simple autoregressive models of current and future investment growth increases significantly when survey variables are included. That said, survey measures do not weight the firms in the sample by the value of their investment, which means that large investment projects, which tend to be in the mining and transport sectors, are likely to be underweighted.
| Survey average(a) | NAB Quarterly Business Survey |
|||||
|---|---|---|---|---|---|---|
| Start of sample period | December 1994 | September 1989 | ||||
| Correlation between survey measure and trend quarterly employment growth |
||||||
| Current quarter | 0.74 | 0.82 | ||||
| Next quarter | 0.73 | 0.80 | ||||
| Explanatory power in an autoregressive model of seasonally adjusted employment growth (adjusted R2) |
||||||
| Current period employment growth(b) | ||||||
| Baseline model (lags of investment growth) |
0.02 | 0.09 | ||||
| Including survey variable | 0.28 | 0.35 | ||||
| Next period employment growth(c) | ||||||
| Baseline model (lags of employment growth) | 0.03 | 0.08 | ||||
| Including survey variable | 0.18 | 0.31 | ||||
|
(a) The survey average is based on the first principal component for: expected
capital expenditure series from the NAB Business Survey, the ACCI-Westpac
Survey of Industrial Trends and the Sensis Business Index
Sources: ABS; ACCI; NAB; RBA; Sensis; Westpac |
||||||


The Role of Surveys in Supplementing Official Data
Services sector output
Some surveys provide industry breakdowns that can be used to provide insights into parts of the economy that are not covered well by official data. While monthly data are available for retail sales, building activity, and exports and imports, most of these largely relate to the production and distribution of goods. In contrast, household and business services firms account for around 40 per cent of GDP, but official estimates of activity in the services sector are only available from the ABS at a quarterly frequency.[5]
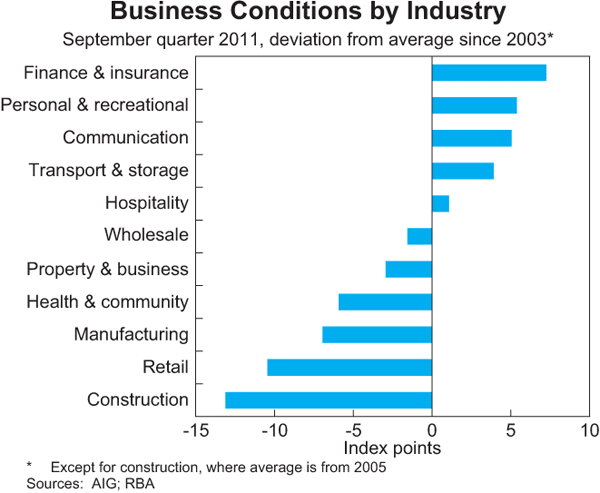
To take a recent example, business conditions data from the NAB and AIG surveys show that activity in the retail and construction sectors has been weak, in line with other sources of data (Graph 5). The same survey measures also show that conditions in the services sector were around long-run average levels. In fact, conditions have been above average in personal & recreational services and hospitality, consistent with household consumption data showing that household spending on discretionary services has been growing stronger than spending on goods. Accordingly, too much emphasis on goods-focused official indicators through this period would have produced an overly pessimistic picture of economic activity.
Capacity utilisation
An important variable in assessing developments in the economy is the level of capacity utilisation. There is, however, no simple measure of capacity utilisation and it is not directly observed. Business surveys are one source of information with both the NAB quarterly business survey and the ACCI-Westpac Survey of Industrial Trends asking longstanding questions on the degree of capacity utilisation (Graph 6).[6]
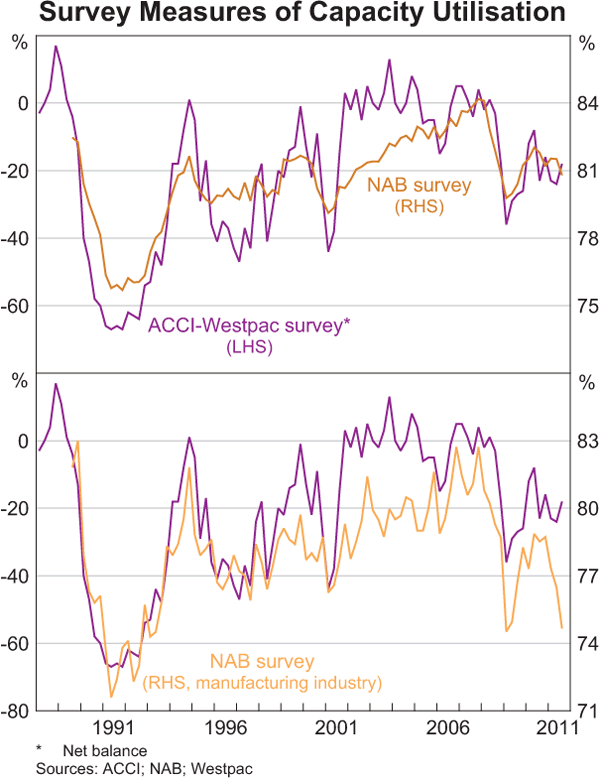
These measures suggest that there were high levels of spare capacity in the economy following the 1990s recession, which were gradually eroded by the mid 2000s. Capacity utilisation fell sharply over 2009, and remains below its average levels over the past decade.
In the case of the manufacturing sector, it appears that there has been a more significant divergence between the ACCI-Westpac and NAB measures of capacity utilisation in the 2000s than had been the case in the 1990s. One possibility is that this divergence reflects differences in the way that the question is asked in the two surveys. In the NAB survey, firms are asked to indicate the level of output relative to full capacity (within certain numerical ranges), with full capacity defined as the maximum level of output using existing labour and capital. In contrast, the ACCI-Westpac survey asks manufacturing firms to compare their capacity utilisation to a ‘normal’ level. If perceptions of the ‘normal’ level of activity had increased over the 2000s – a period of extended economic growth – this could explain why the NAB survey shows an increase in capacity utilisation while the ACCI-Westpac shows it remaining at a high level. This would not be surprising in light of evidence from the UK for the CBI survey which showed that when asked to compare a variable such as ‘order books’ to its ‘normal’ level, some firms compared their current order books to budget paths while 60 per cent of firms compared their current order book levels with a past level or historical average, with three-quarters of these reporting that this ‘normal’ changed over time (see Bush (2008)). This research highlights the importance of considering survey design – in this case, the exact wording of the question – in interpreting survey data.
Availability of credit
Another example of how survey data can be used to supplement official data is in assessments of credit availability. While aggregate credit data can reflect changes in both demand for credit from borrowers and banks' willingness to lend, survey questions on availability of finance can provide information on supply-side constraints faced by businesses wanting to borrow. During the global financial crisis, credit growth slowed sharply, with survey data suggesting that this was partly due to a tightening in supply. Taking the ACCI-Westpac survey as an example, difficulties in obtaining finance rose sharply in late 2008, as credit risk increased and lenders tightened lending terms and conditions, and remained high into 2011 (Graph 7). Some surveys also ask about the availability of credit relative to other constraints on business. While more firms reported difficulties accessing credit in 2009, the Sensis Business Index and ACCI Survey of Investor Confidence suggested that credit constraints were less of a concern than other factors such as the slowing in economic activity.
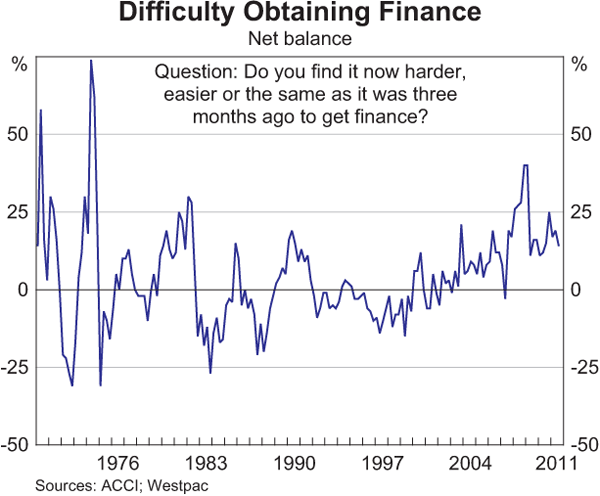
Credit availability is another example of a situation where it is not clear whether firms are responding to the survey in the manner intended. Given the phrasing of the survey question, read literally, Graph 7 suggests that access to finance has been becoming progressively more difficult – the series is above zero – even in 2011, which is in contrast to a range of other information, including reports from the Bank's liaison program. Again, the UK evidence is that a substantial number of firms answer questions about changes in a variable in terms of the level of that variable. If Australian firms are answering questions about credit availability in terms of the level of credit availability, the series may be indicating that it is still more difficult to access credit than before the financial crisis, rather than indicating that credit conditions have tightened continuously for about four years.
Topical events
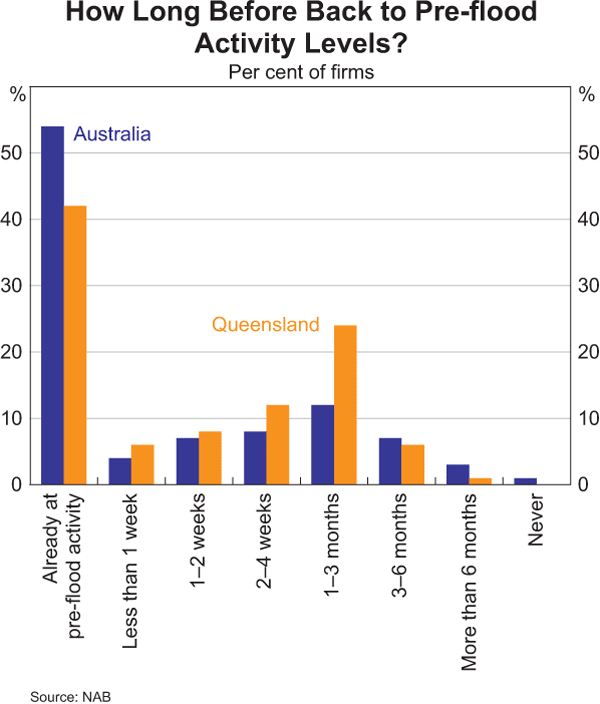
Many Australian business surveys also include ad hoc questions on topical issues. For example, with floods and storms weighing on business sentiment in early 2011, a sequence of supplementary questions were included in the NAB Monthly Business Survey conducted in late January, well before any official economic data relating to this period were released. Of particular interest was a question about the expected return to normal activity: this suggested that business activity had returned to pre-flood levels by late January for 40 per cent of the affected firms in Queensland, while more than 90 per cent of firms expected that their activity would have fully recovered within three months of the survey's date (Graph 8). Such data were used to inform early estimates of the impact of extreme weather on economic activity (RBA 2011).
Conclusion
While it is important to interpret survey information with care, being mindful of the influence of survey design, business surveys provide useful information about current and future economic activity, and also provide information on parts of the economy not otherwise readily available. Survey responses that are published on a more timely basis than official data can be used to provide an early read on economic activity, particularly on growth in domestic demand. In addition, forward-looking survey measures such as business confidence and hiring and investment intentions assist in forecasting domestic demand, employment and investment growth. Finally, survey measures of capacity utilisation and availability of finance, and detailed sectoral data, are a useful complement to official data.
Footnotes
The author is from Economic Analysis Department. [*]
Earlier research by the Bank found that survey measures can provide useful information about growth in output, employment and selling prices. See Aylmer and Gill (2003) and Roberts and Simon (2001). [1]
Other surveys are also monitored by the Bank, including surveys for particular regions and those with specific focuses, such as the farm sector and commercial property. [2]
These autoregressive models use seasonally adjusted measures of GDP and domestic demand, while trend measures are shown on graphs and used to calculate reported correlation coefficients because they are smoother. [3]
The survey average is based on the first principal component of expected business confidence in the next quarter from the NAB Quarterly Business Survey, the general business situation in the next six months from the ACCI-Westpac Survey of Industrial Trends and perceptions of the economy in the next 12 months from the Sensis Business Index. [4]
Services are defined to include accommodation & food services, information, media & telecommunications, finance & insurance, rental, hiring & real estate, professional, scientific & technical, administrative & support, health care & social assistance, education, arts & recreation and other services, but exclude goods distribution industries such as wholesale and retail trade. If these are included, the services sector accounts for closer to 50 per cent of GDP. [5]
Measures of capacity utilisation are also available in the AIG surveys; for the construction sector, the MBA National Survey of Building and Construction and the HIA Trades Survey provide capacity utilisation measures. [6]
References
Aylmer C and T Gill (2003), ‘Business Surveys and Economic Activity’, RBA Research Discussion Paper 2003-01.
Bush O (2008), ‘Answering Practices in the CBI Industrial Trends Survey – New Data and New Questions’, in European Commission Workshop on Business and Consumer Surveys, Brussels, 10–11 November. Available at <http://ec.europa.eu/economy_finance/db_indicators/surveys/documents/workshops/2008/ec_meeting/wood_cbi.pdf>.
RBA (Reserve Bank of Australia) (2011), ‘Box B: An Update on the Impact of the Natural Disasters in Queensland’, Statement on Monetary Policy, May, pp 40–43.
Roberts I and J Simon (2001), ‘What do Sentiment Surveys Measure?’, RBA Research Discussion Paper 2001–09.