Bulletin – June 2010 Housing Turnover and First-home Buyers
- Download the article 262KB
Abstract
While housing turnover varies over time, on average, around 6 per cent of the housing stock, or around 500,000 dwellings, change ownership each year. In 2009, first-home buyers accounted for an unusually large share of this turnover, although this share has since declined. As first-home buyers make greater use of mortgages to fund purchases than do repeat buyers, this shift in the composition of turnover helps to explain the recent divergence in movements in housing prices and loan approvals.
Introduction
Periods of strong growth in housing prices are usually associated with a pick-up in turnover in the housing market and an increase in housing loan approvals. Shifts in the mix of buyers in the housing market can, however, affect the relationship between prices, turnover and finance. This article reviews recent trends in housing turnover in Australia, including changes in the role played by first-home buyers. It also discusses recent trends in housing finance.
Housing Turnover and Financing
There are no timely official data on the number of housing transactions in Australia. Measures can, however, be constructed using data from private-sector entities which purchase information on land title transfers from state lands departments and supplement this with other information on dwelling sales. Owing to lags in the collection process, reliable estimates are typically not available until around six months after the reference period, with initial estimates usually underestimating the number of property transactions that actually took place.[1] An alternative and timelier source of information is provided by lending statistics from financial institutions, including the monthly housing loan approvals data, although the usefulness of these data as a measure of turnover is limited by the fact that not all home purchases involve a loan from a financial institution. An additional source of disaggregated information on the characteristics of households that buy their homes is the household surveys, including the Household, Income and Labour Dynamics in Australia (HILDA) Survey and the ABS Survey of Income and Housing (SIH), with the latest SIH for 2007/08 including a special module on Housing Mobility and Conditions.
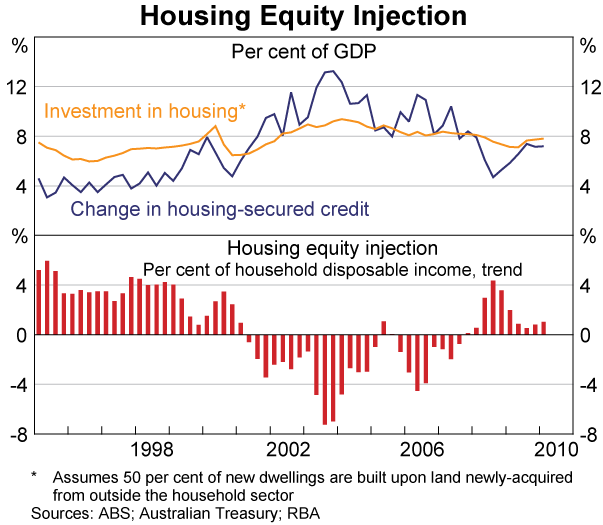
The estimates of turnover from private-sector providers suggest that in the past five years an average of around 500,000 dwellings have been sold each year, or around 6 per cent of the total number of dwellings (Graph 1).[2] These estimates also suggest that housing turnover has varied significantly over time. Turnover was particularly high during the period of strong housing price and credit growth in 2002–2003, when it rose to around 7½ per cent of the number of dwellings, partly reflecting a high level of investor activity. At the same time, housing equity withdrawal also rose and reached its peak level in late 2003 (Graph 2).[3] By comparison, the recent rise in housing prices has been accompanied by only a modest increase in turnover, to around average levels, with the increase mostly driven by first-home buyers. In late 2009, housing turnover was well below the levels reached earlier in the decade and households continued to inject equity into the housing stock.
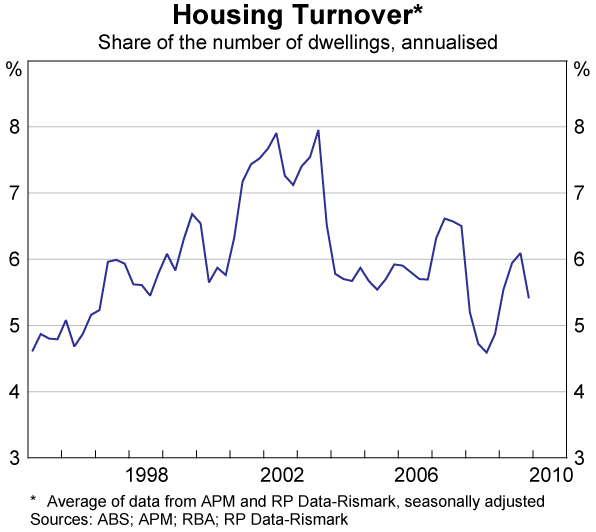
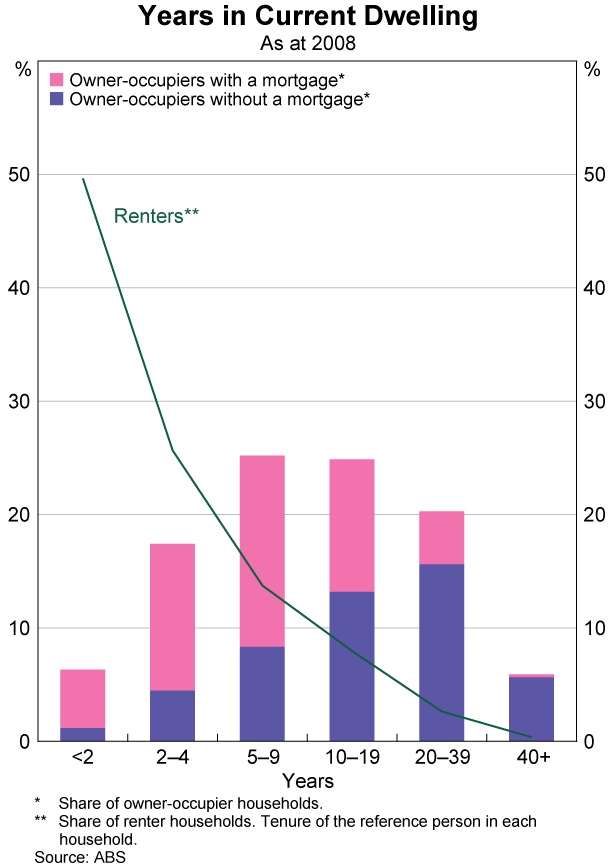
The 6 per cent average rate of turnover suggests an average holding period of about 17 years, although this aggregate estimate masks significant differences in turnover across households. Data on household tenure from the SIH suggest that in 2008 around one-quarter of owner-occupier households had not moved for over 20 years, and over half of owner-occupiers had been in the same home for at least 10 years (Graph 3).[4] On the other hand, of those households that had been in their dwelling for less than five years in 2008, around half had moved at least twice during that period. As might be expected, younger households account for a greater share of moves than older households; households with a household head aged between 25 and 44 years account for over half of all owner-occupier household movements. Renters also move more often than owner-occupiers, with around half of all renters reported to have been in their current dwelling for less than two years in 2008. Across the states, housing turnover has typically been highest in Western Australia and Queensland, partly reflecting higher population growth. Estimates suggest that over the past decade, on average, around 7 per cent of the dwellings in Western Australia and Queensland changed ownership each year, while an average of around 5 per cent were sold each year in the other states.
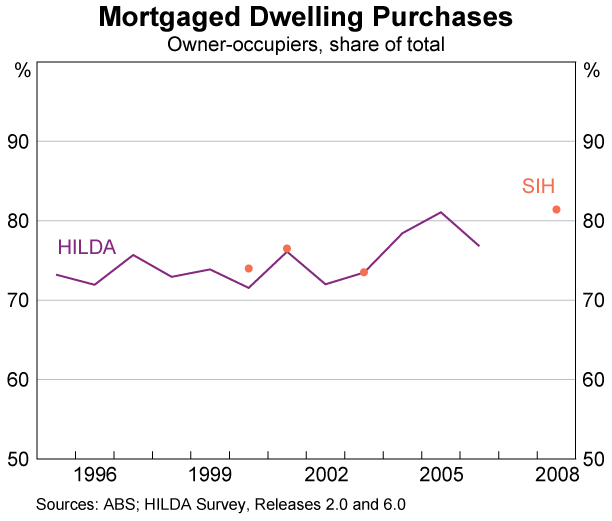
With regard to financing, household survey data suggest that around one-quarter of dwelling transactions do not involve a mortgage (Graph 4).[5] This is consistent with data from lands departments in New South Wales and Victoria on land title transfers. The surveys also suggest that the proportion of transactions with a mortgage has risen over recent years, partly reflecting the rising cost of housing.
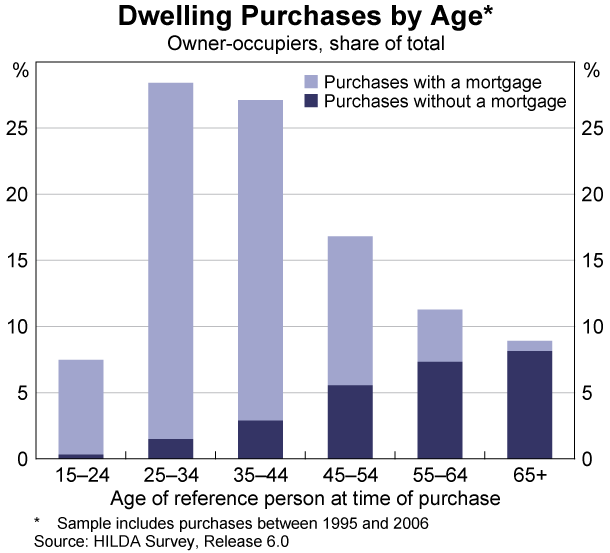
As might be expected, households that have been in their dwelling the longest are less likely to have a mortgage, with many of these households having paid off their housing loan. As at 2008, around half of all owner-occupier households had a mortgage, but only around one-fifth of those that had been in the same dwelling for more than 20 years had a mortgage (Graph 3). Not surprisingly, household surveys also suggest that housing purchases with mortgage finance are more common for younger households than for older households, as older households have built up higher levels of housing equity and other wealth. Since 1995, around 85 per cent of purchases by younger households involved a mortgage, compared with only around 20 per cent of purchases by households with a head over 55 years of age (Graph 5). The SIH also asks households questions about their motivation for moving, with households with a head over 55 years twice as likely to have reported that they moved to ‘downsize’ or for a ‘lifestyle change’ compared with younger households. In many cases this is likely to involve moving to a lower-valued property, further lessening the need for mortgage finance.
First-home Buyers
Over the past decade, first-home buyers have accounted for around 25–30 per cent of all home sales, although there has been significant variation in this proportion over time, partly reflecting changes in government grants to first-home buyers and the level of interest rates. In late 2008 and through 2009, first-home buyer activity was increased by the Australian Government's First Home Owners Boost, which was introduced in October 2008 and phased out in late 2009. First-home buyer activity was also boosted by state government grant supplements and the reduction in interest rates over late 2008 and early 2009. In mid 2009, the number of first-home owner grants rose to its highest level on record, with grant recipients accounting for more than 40 per cent of total housing turnover (Graph 6). The number of first-home buyer housing loan approvals also rose to its highest share of total housing turnover since at least the mid 1990s. More recently, the share of first-home buyers in the housing market has declined, reflecting the reduction of most of the government grants and the increase in mortgage rates to around average levels. Given that first-home buyer loan approvals and grants have both fallen by around 30 per cent in the March quarter 2010, the first-home buyer share of overall housing turnover is likely to have declined significantly over the period.
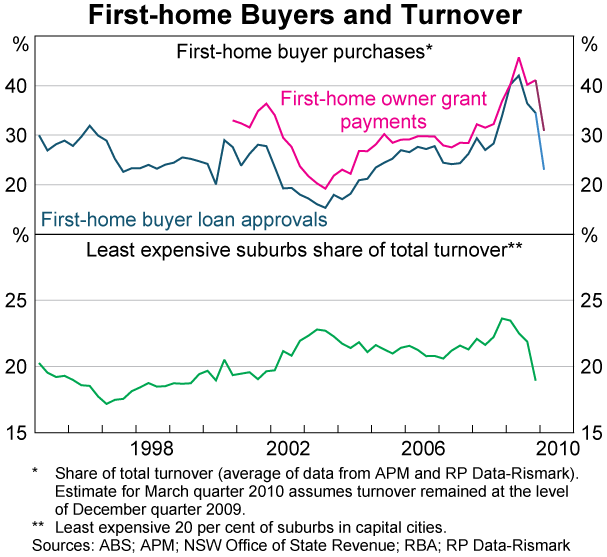
The run-up and subsequent decline in first-home buyer activity has had an effect on the composition of housing turnover as, on average, first-home buyers are likely to buy less expensive houses than other buyers. Partly reflecting this, the share of total housing turnover in the least expensive suburbs rose during 2008 and remained elevated in early 2009. The subsequent decline in first-home buyer purchases has seen the share of housing turnover in the least expensive suburbs fall sharply, back to levels seen around the start of the decade.
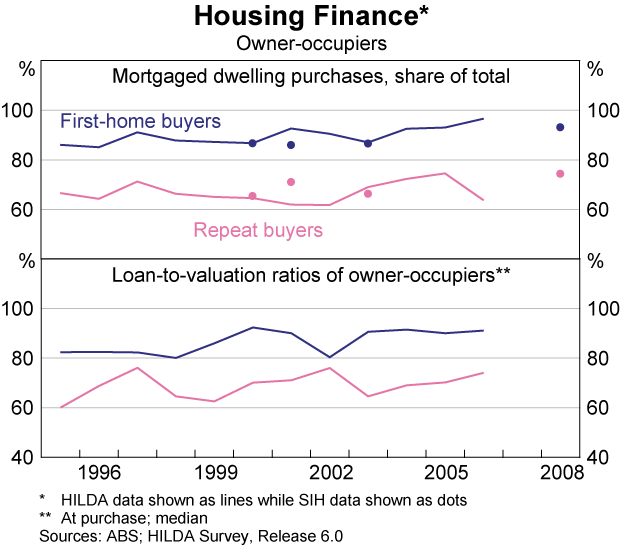
The changes in first-home buyer activity have had implications for measures of new lending, as first-home buyers are significantly more likely than repeat buyers to purchase a dwelling with a mortgage. Household surveys suggest that, on average, around 90 per cent of purchases by first-home buyers involve a mortgage, compared with around 65 per cent of owner-occupier repeat-buyer purchases (Graph 7). The share of mortgaged purchases by first-home buyers has also trended upwards over the past decade or so, which reflects both the increased availability of credit and the increase in housing prices relative to incomes. Consistent with this, there has been a modest upward trend in first-home buyer initial loan-to-valuation ratios over this period.
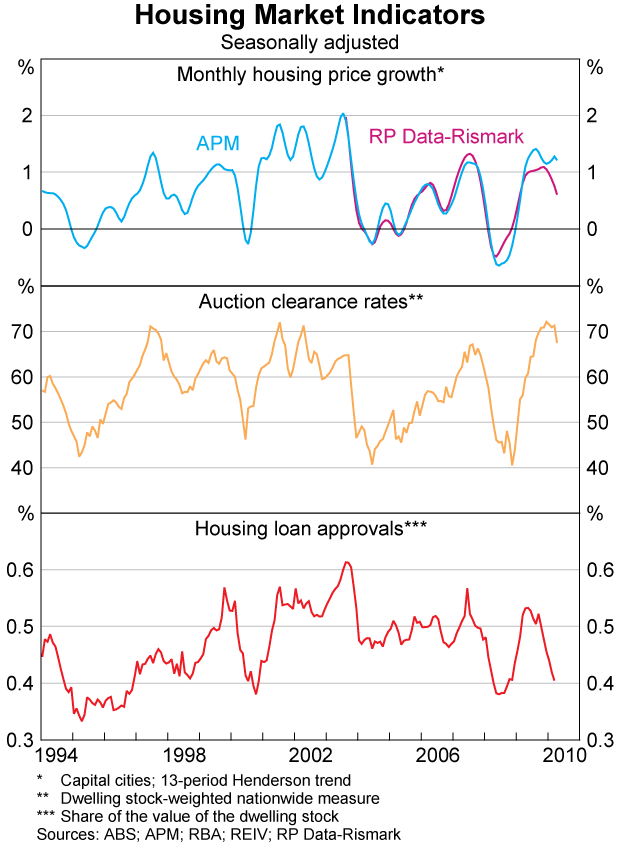
The combination of large movements in the first-home buyer share of housing turnover and the greater propensity of first-home buyers to use mortgages from financial institutions helps to explain the recent divergence between housing loan approvals and housing price growth. While movements in housing prices, auction clearance rates and housing loan approvals are typically highly correlated, over the six months to March 2010 the value of housing loan approvals fell by 16 per cent, while auction clearance rates and growth in housing prices remained buoyant (Graph 8). A rise in the proportion of housing purchases not involving mortgages from financial institutions, due to declining first-home buyer activity, provides part of the explanation for the divergence. The timing of the rise and fall in first-home buyer activity also corresponds with housing price developments at the lower end of the housing market. Housing prices in the least expensive suburbs began to increase in late 2008, earlier than the rise in the upper part of the market, and growth in housing prices in the least expensive suburbs has eased recently, consistent with reduced first-home buyer purchases. As the composition of housing turnover normalises, the more typical relationship between housing price growth, loan approvals and auction clearance rates is likely to be re-established.
Footnotes
The authors are from Economic Analysis Department. [*]
In the past, these data problems also made measuring growth in housing prices difficult as the early samples of sales were not representative of the broader housing stock. However, statistical approaches to control for these, and other issues associated with changing sample composition, have helped overcome this problem (see for example, Hansen, Prasad and Richards 2006). [1]
These estimates will understate total turnover as they do not include all newly built dwellings and transfers within families that are not sales. [2]
When people move house they often withdraw equity which is used for other expenditure, for example on other assets (see Schwartz et al 2006). Housing equity withdrawal (injection) is defined as the extent to which the net change in borrowing for housing is above (below) the net change in the housing stock (including alterations and additions). [3]
While the SIH tracks households, rather than dwellings, movements of owner-occupier households between dwellings are highly correlated with dwelling sales. The SIH suggests that in 2008, on average, owner-occupier households had been in their dwellings for 15 years. [4]
Estimates from HILDA are based on questions in both the 2002 and 2006 surveys about whether the household purchased their current dwelling with a mortgage and when that purchase occurred. The SIH estimates are based on questions about whether a household has purchased a dwelling and whether they have a mortgage on their dwelling in the survey years: 1999/00, 2000/01, 2002/03 and 2007/08. [5]
References
Hansen J, N Prasad and A Richards (2006), ‘Measuring Housing Prices: An Update’, RBA Bulletin, June, pp 1–7.
Schwartz C, T Hampton, C Lewis and D Norman (2006), ‘A Survey of Housing Equity Withdrawal and Injection in Australia’, RBA Research Discussion Paper No 2006-08.