Bulletin – October 1996 Quarterly Report on the Economy and Financial Markets
- Download 272KB
Introduction
Late in July, the Bank lowered the overnight cash rate by 0.5 per cent. This recognised both a markedly better short-term inflation prospect and an assessment that the economy had the potential to grow a little faster without adding to inflation. Financial markets responded favourably to the cut in official interest rates. While the exchange rate dipped on announcement of the easing, it subsequently recovered, partly with the assistance of a stronger US dollar, to show little net change over the quarter. The encouraging near-term outlook for inflation, and the tightening of fiscal policy contained in the Budget, meant that bond yields have fallen against those in the United States and elsewhere.
The change seems to have helped confidence a little, but, on the whole, developments since then have been consistent with the Bank's outlook at that time. On present indications, inflation should soon be comfortably within the 2–3 per cent range. The real economy – as reflected in GDP growth, the labour market, investment, imports, profits, and business sentiment – continues to present a mixed picture, as would be expected from an economy growing somewhere near its long-term trend. Some sectors are growing quite strongly, but others – manufacturing, for example – remain listless. Employment growth, while strong enough to absorb new entrants to the labour force, has not made inroads into unemployment over the past year.
There may be potential for the economy to grow a little faster than at present without threatening inflation, but this depends largely on wage prospects. The subdued labour market of the past year has reduced the growth rate of the usual overall measure of wages – ordinary-time adult earnings (AWOTE) – from over 5 per cent in 1995 to under 4 per cent – which is consistent with the 2–3 per cent inflation target endorsed by the Bank and the Government. But enterprise bargains – a more forward-looking indicator of the ongoing direction of wage growth – are running at over 5 per cent (and higher still for the private sector and executive salaries), with no signs of deceleration. These increases have been consistent with an overall wage outcome of less than 4 per cent only because a significant part of the labour force has received modest increases.
Excessive wage agreements adversely affect growth and employment prospects in a variety of ways: they discourage employment directly; they reduce profits, which in turn affects investment – the linchpin of forecast growth; and they require monetary policy to be held firmer than otherwise to maintain the 2–3 per cent inflation objective. A disappointing aspect of this development is that some wage negotiations seem to have been based on higher inflation than has, in fact, been recorded. At the economy-wide level, inflation has averaged 2½ per cent per annum over the past five years and seems likely to soon resume that rate. It is quite erroneous, and almost certainly disruptive, to assume a higher rate in wage negotiations. At the industry level, the disparity is often more marked; in manufacturing, for example, competitive pressures leave firms little capacity to increase prices at all to cover rising wage costs, yet 5 per cent wage bargains have been struck.
Just how this conflict will be resolved remains to be seen. Wider recognition of low inflation, combined with a squeeze on profits in those areas where wage increases have been excessive, may reduce enterprise bargaining outcomes (although it is disappointing that this has not happened already). Good inflation figures over coming months should also improve the likelihood of this as they contribute to reducing the community's inflationary expectations.
Other things equal, a reduction in inflationary expectations would support the case for a reduction in the overnight cash rate. Should the economy turn out to be clearly weaker than current projections assume, with likely additional downward pressures on wage bargains and inflation, that case would be strengthened. On the other hand, on current growth projections, and without evidence that wages are adjusting to the lower inflation environment, a relaxation of monetary policy could have the effect of storing up problems for the future.
The International Economy
Economic conditions
The major economies continued to move ahead in the September quarter, although they are in different phases of the cycle. The United States has performed quite strongly so far in 1996, but is in the mature phase of the cycle, without the spare capacity to continue above-trend growth. Japan is in the early stage of recovery, after three years of virtually no growth. Germany, too, is in the early phase of expansion, and the recovery seems to be assured. Globally, inflation remains low.
| GDP | Core CPI(a) | |
|---|---|---|
| US | 2.7 | 2.6 |
| Japan | 3.9 | 0.2 |
| Germany | 1.1 | 1.5 |
| Canada | 1.2 | 1.3 |
| France | 0.4 | 1.4 |
| UK | 2.3 | 2.8 |
| Italy | 0.7 | 3.4 |
| Netherlands | 2.8 | 2.5 |
| Sweden | 1.2 | 1.4 |
| Switzerland | −0.5 | 0.8 |
| Belgium | 0.5 | 2.4 |
| Australia | 4.5 | 3.1 |
| New Zealand | 2.1 | 2.3 |
|
(a) CPI excluding food, unless an alternative definition is published by the national authorities. Italy's CPI is the headline rate. Latest data refer to the year to August, except for Australia and New Zealand (June quarter) and Sweden, Netherlands and Switzerland (July). Sources: National governments and OECD statistics. |
||
North America
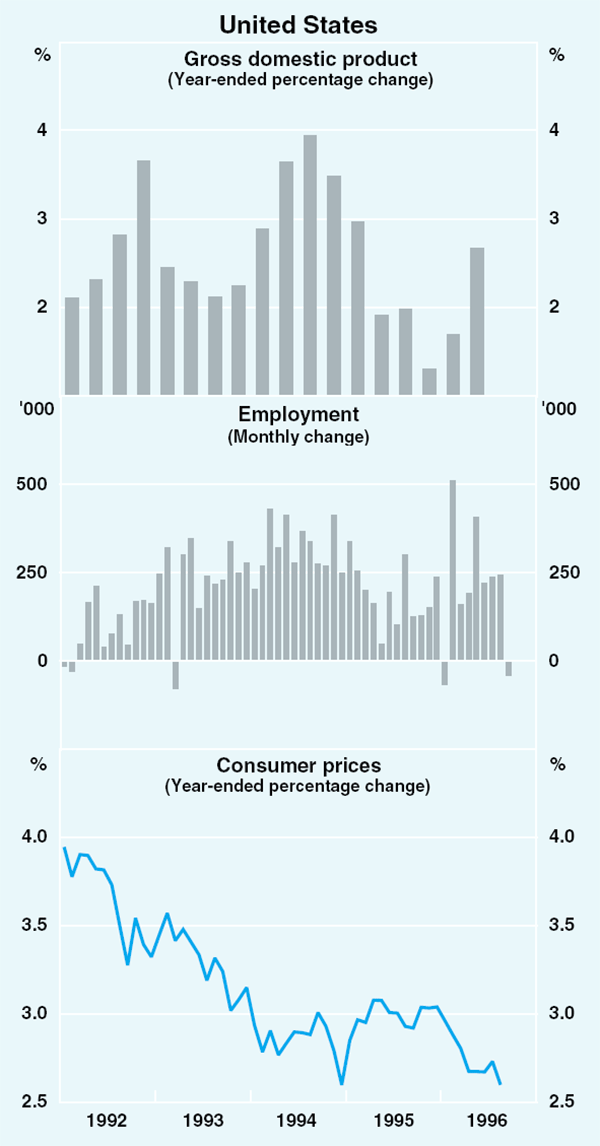
In the United States, GDP grew strongly (by 1.1 per cent) in the June quarter. With average employment growth of around 240,000 per month over the six months to August (Graph 1), the unemployment rate fell to a seven-year low of 5.1 per cent, clearly below the levels at which, historically, inflationary pressures have become apparent (Graph 2). This led to strong speculation that monetary policy might be tightened to restore a more sustainable growth rate. In the event, the Fed did not increase official interest rates in the September quarter. Inflation remained subdued, but recent evidence on economic activity has been ambiguous: industrial production and housing continued to look strong; and consumers and businesses remained confident. The main consistently contrary indicator was retail sales, which showed only moderate growth in the quarter. Employment also fell in the month of September, although the unemployment rate was 5.2 per cent, still suggestive of tight labour market conditions.
Some commentators argue that flexibility, competition and international integration have reduced America's susceptibility to inflation, but the majority accept that the US cannot continue to grow above trend without this causing inflation: the debate centres on whether such slowing in activity will require tighter policy, or will occur spontaneously.
Labour market pressures have become gradually more apparent in wage costs, with average hourly earnings for private employees rising by 3.5 per cent over the year to September. Despite this, there were no signs of rising price inflation: in the year to August, core producer prices rose by 1.4 per cent, while core consumer prices rose by 2.6 per cent.
In Canada, core inflation remains in the lower half of the Bank of Canada's target of 1 to 3 per cent, economic activity remains weak, and the exchange rate has been steady. This gave the Bank of Canada latitude to ease monetary policy by a total of 1 percentage point since end June, bringing the midpoint for the range for official interest rates to 3¾ per cent.
Asia-Pacific
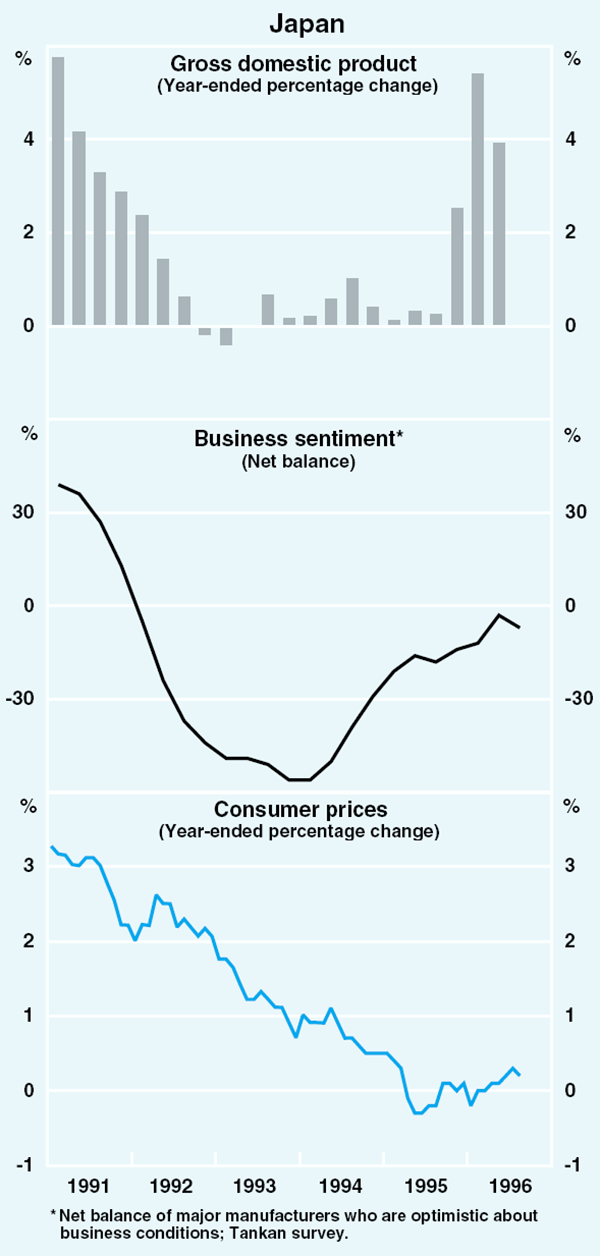
Reading through the ‘noise’ in the statistics, the Japanese economy seems to be tracking an upward path, with low interest rates, ongoing fiscal stimulus, and a competitive exchange rate boosting activity. With the financial sector's balance sheets still undergoing restructuring and business confidence fragile, however, private spending has gathered only limited momentum. The fall in GDP of 0.7 per cent in the June quarter reversed only a small part of the very big increase in the March quarter; over the year to June, GDP rose by 3.9 per cent. While retail sales remain subdued, housing starts have grown strongly and business expectations for investment have improved. Inflation remains low; core consumer prices increased by 0.2 per cent in the year to August (Graph 3). Against this background, and with fiscal stimulus set to be withdrawn, the Bank of Japan has signalled an inclination to persist with the current stimulative stance of monetary policy.
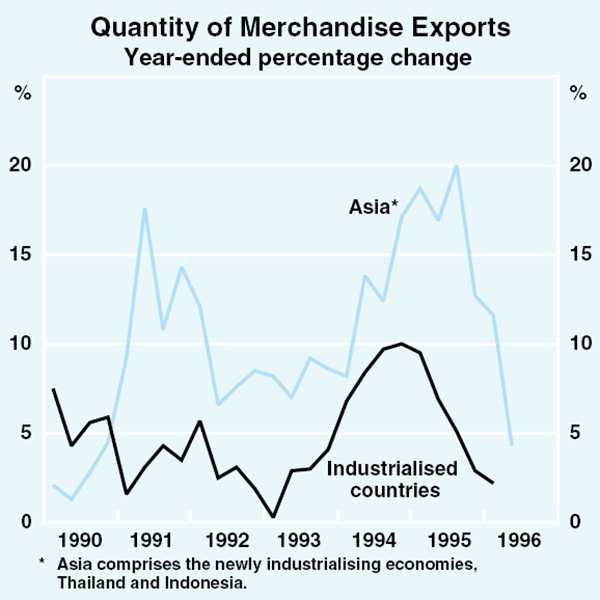
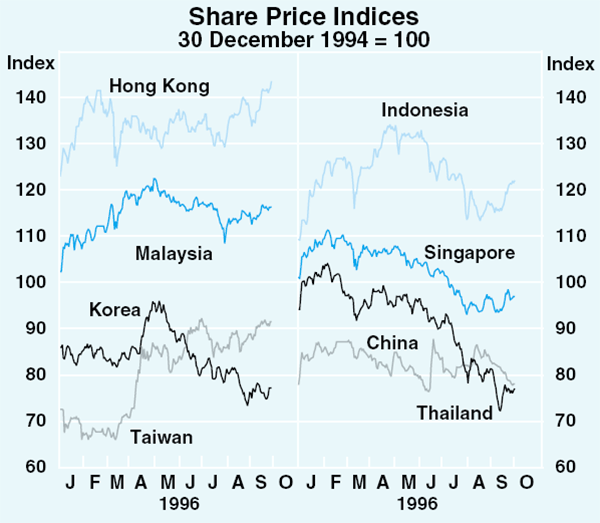
Elsewhere in Asia, some slowing is evident in a number of countries. Although forecasts for growth in 1996 have been revised down in some countries, they remain high by standards of industrialised countries. The slowdown reflects weaker growth in exports, partly reflecting weak global demand for electronic products (Graph 4).
In Korea, slower growth in exports and subdued investment have slowed economic activity, but inflationary pressures have intensified, reflecting strong wages growth and the depreciating won. In Taiwan, industrial production remains depressed and the unemployment rate has reached a ten-year high. Tightening monetary policy has reinforced the slowing of external demand in Malaysia, Thailand and Indonesia. While inflationary pressures have abated in Thailand and Malaysia, current account deficits remain large. Economic growth in Hong Kong and Singapore has also slowed. China's economy, on the other hand, continues to expand rapidly, underpinned by robust investment. With lower inflation, credit restrictions have been eased further.
|
Real GDP Percentage change in year to latest(a) |
Consumer Prices Percentage change in year to latest(b) |
|
|---|---|---|
| China | 9.8 | 8.1 |
| Hong Kong | 3.1 | 4.9 |
| Indonesia | 8.1 | 7.0 |
| Malaysia | 8.4 | 3.5 |
| New Zealand | 2.1 | 2.3 |
| Philippines | 5.8 | 7.9 |
| Singapore | 7.0 | 1.4 |
| South Korea | 6.7 | 4.7 |
| Taiwan | 5.4 | 5.1 |
| Thailand | 8.6 | 4.6 |
|
(a) For China, data are for the first half of 1996, compared with the same
period in 1995; for Thailand and Indonesia, the data are for 1995. Data
for Hong Kong are for the year to the March quarter. For the remaining
countries, data are for the year to the June quarter. Sources: National governments. |
||
Economic growth in New Zealand has slowed in response to firm monetary conditions; the central bank expects growth in GDP of 2 per cent in the year to March 1997. Underlying inflation was 2.3 per cent in the year to the June quarter and is forecast to move higher in the immediate future, before returning to the 0–2 per cent target by June 1997.
Europe
In Europe, signs of a return to growth are emerging, but progress remains uneven. Easings of official interest rates over the past year have helped support economic activity, but announced budget cuts continue to weigh on business and consumer confidence.
In Germany, GDP rose by 1.5 per cent in the June quarter, and by 1.1 per cent over the past year. Improvement continued early in the September quarter, with industrial production 2.2 per cent higher in July/August than the average for the June quarter; rising manufacturers' orders suggest further growth lies ahead. Business sentiment is improving, but remains subdued (Graph 5). Economic conditions elsewhere in continental Europe generally lag those in Germany, with GDP contracting in Italy and France in the June quarter, and output falling in Switzerland over the past year. Notwithstanding prospects of continued slow growth, some European countries, including Germany, France, Spain and Italy, announced programs of fiscal consolidation in recent months, with the aim of complying with the Maastricht fiscal criteria.
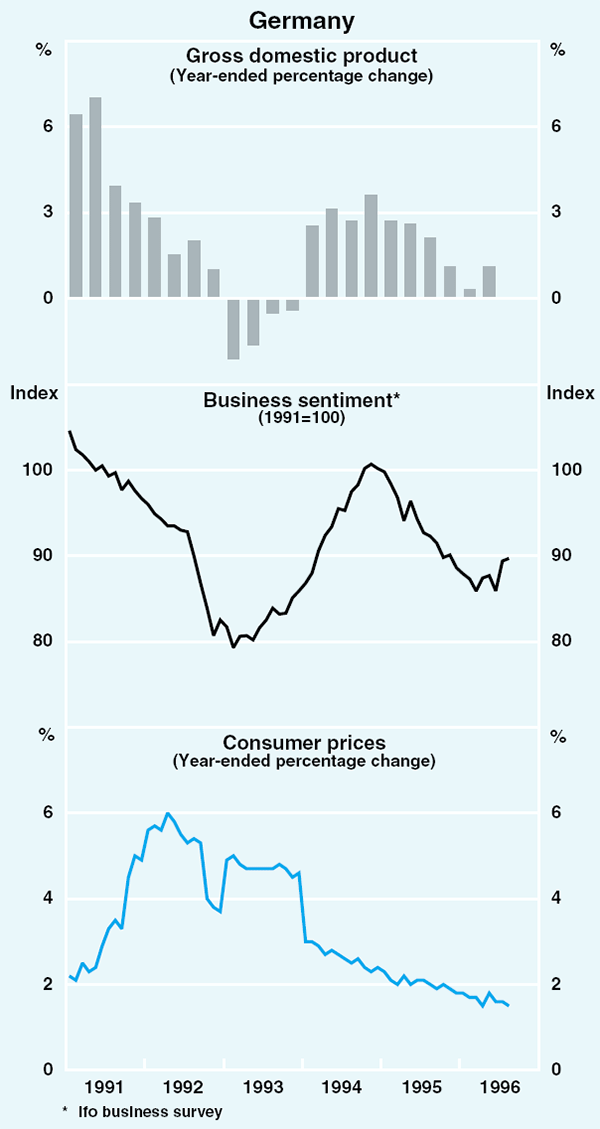
Inflation across Europe remains low: Germany, where core consumer prices rose by 1.5 per cent in the year to August, is typical. The combination of sluggish economies and low inflation set the scene for widespread easings of monetary policy. The Bundesbank reduced official interest rates by 30 basis points to 3.0 per cent late in August. Many other European central banks also reduced official interest rates, both before and after the Bundesbank's move.
Economic growth has been stronger in the United Kingdom than elsewhere in Europe: GDP rose by 2.3 per cent over the year to the June quarter, with core inflation of 2.8 per cent in the year to August. After easing policy through the first half of 1996, monetary policy has been unchanged throughout the September quarter.
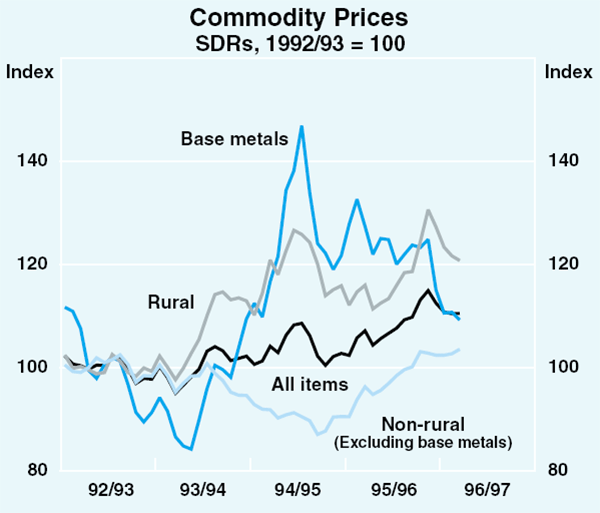
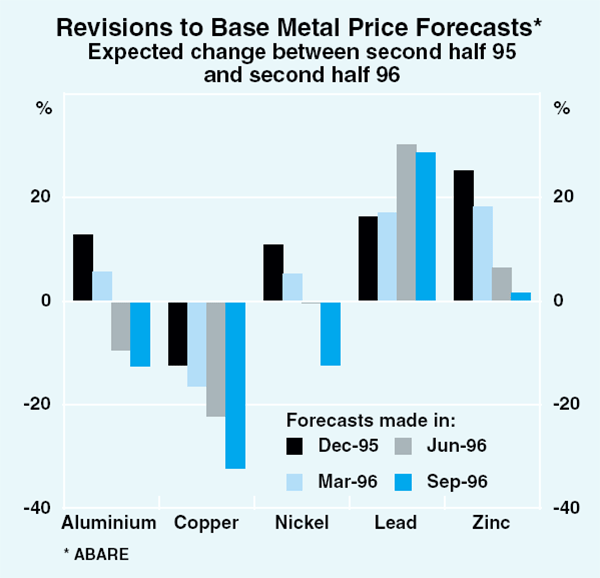
Movements in commodity prices usually reflect changing assessments of world growth. Other influences, however, have also been important in recent commodity price developments. The Bank's commodity price index fell by 2.7 per cent in SDR terms in the September quarter, driven mainly by lower prices for wheat and further falls in base metal prices (Graph 6). The decline in the wheat price, which more than reverses the rise in the previous quarter, is due to more favourable global growing conditions. Base metals prices were driven lower by the Sumitomo effect on copper prices; aluminium price falls reflect the ending of the producers' agreement to restrict supply. But the downward revisions to commodity price forecasts also suggest a more pervasive reassessment (Graph 7).
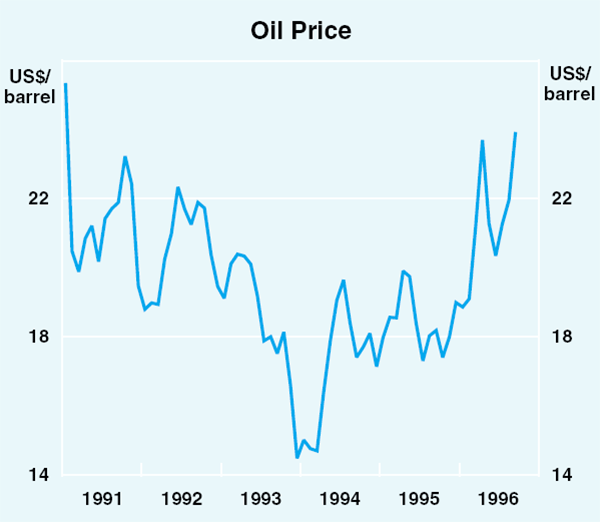
The price of oil rose by more than 10 per cent over the September quarter as tension with Iraq resurfaced. Oil prices were around US$24 a barrel in late September, a little below their recent peak of US$25.25 in April. Oil prices at end September were 30 per cent higher than their level of a year ago, suggesting that they could be a danger point for inflation in the major industrial countries unless recent upward pressure subsides (Graph 8).
International Financial Markets
Capital markets
The upward movement in long-term interest rates around the world, which characterised the first half of 1996, has been reversed over recent months in most countries (Graph 9). The United States is an exception in that rates have steadied rather than fallen; yields on 10-year securities, which had risen by over 100 basis points between January and June, have remained in a range of 6½ to 7 per cent since then. Movements to either end of this range have been driven mainly by fluctuating expectations about the outlook for growth and inflation in the US economy and the expected response of US monetary policy. In June, markets had been confidently expecting tighter monetary conditions in the US; but in the event, a period of more mixed indicators of economic activity, and continued stability in price inflation, has seen the Federal Reserve keep short-term interest rates steady.
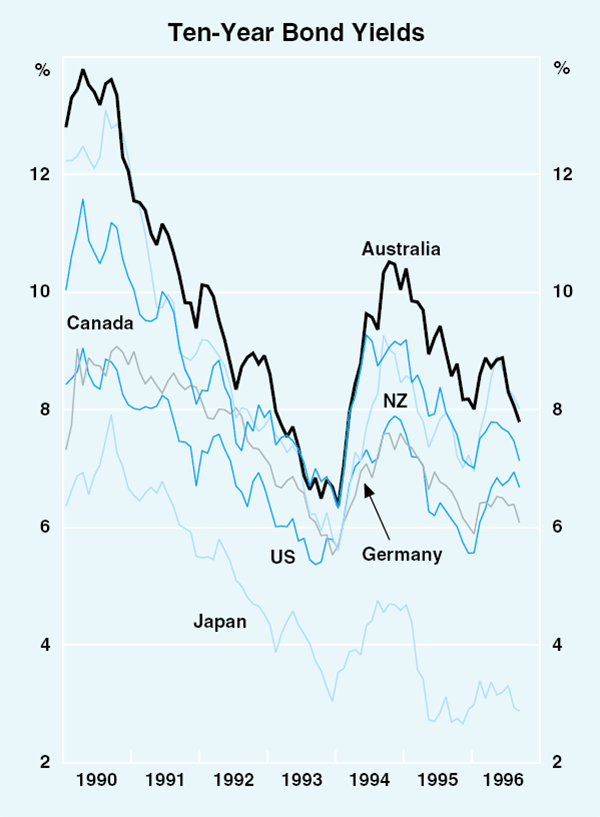
In Germany and Japan, bond yields have fallen appreciably over the past few months and in both cases are at their lowest levels since the beginning of the year. German yields have benefited from the easing in monetary policy, continuing very low inflation and further steps by the German Parliament towards fiscal consolidation. In August, uncertainty about the likelihood of European Monetary Union proceeding on time caused some widening of yield differentials between Germany and other European countries, particularly Italy and Spain. These movements were quickly reversed, however, and the general trend towards convergence in European bond yields which has been in place over the past year or so continued.
In Japan, the main factor driving yields down has been an unwinding of earlier expectations of an imminent tightening of monetary policy by the Bank of Japan. By the end of September, yields on 10-year Japanese Government Bonds had fallen to 2.8 per cent, close to an historic low, from around 3.2 per cent at the end of June. Overnight interest rates in Japan remained at around 0.5 per cent.
Share markets in most of the major countries have risen over the past few months although, as in other financial markets, there have been periods of volatility (Graph 10). As usual, the US market was the key to developments in most other markets. With the Dow Jones index near record levels at the end of June, investors had become increasingly cautious about the high level of prices. Some weaker-than-expected profits reports heightened these fears and, when strong employment data in the US led to speculation of a rise in short-term interest rates, share prices fell quite sharply. Share prices in most other markets followed the US lead.
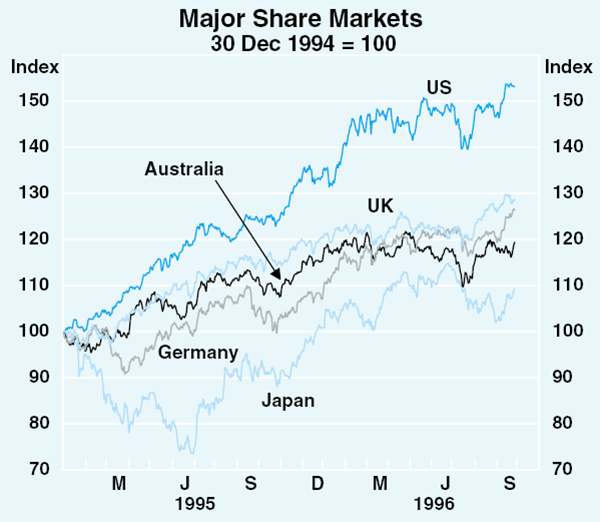
Subsequently, the US share market recovered from this fall. By the end of September, in fact, the Dow Jones index had reached new record highs, helped by the decision of the Federal Reserve to leave interest rates unchanged. The UK and German share markets also recovered, achieving record highs. The main exception to the general trend was in Japan. The Nikkei has fallen by around 5 per cent since its 1996 high in June as investors became less optimistic about the economic outlook.
Asian share markets have also been influenced by developments in the US, with most markets moving down with the US market in July (Graph 11). Since then, however, only the Hong Kong and Taiwan markets have recovered; most markets are at lower levels than in June, with sentiment weighed down by signs of slower growth. The Thai stock market in particular has been weaker than most, with share prices down by around 15 per cent over the past three months.
Foreign exchange markets
The upward trend in the US dollar which had been apparent in the first half of 1996 has paused over recent months (Graph 12). Early in July, instability in the US share market flowed into currency markets and the US dollar fell by around 3½ per cent against both the yen and the German mark, much of the decline occurring in one day. It traded in a range around 1.48 marks and 108 yen through most of August and September, before moving up to around 1.52 marks and 110 yen by late September, about the same levels as at end June. In trade-weighted terms, the US dollar is likewise little changed over recent months.
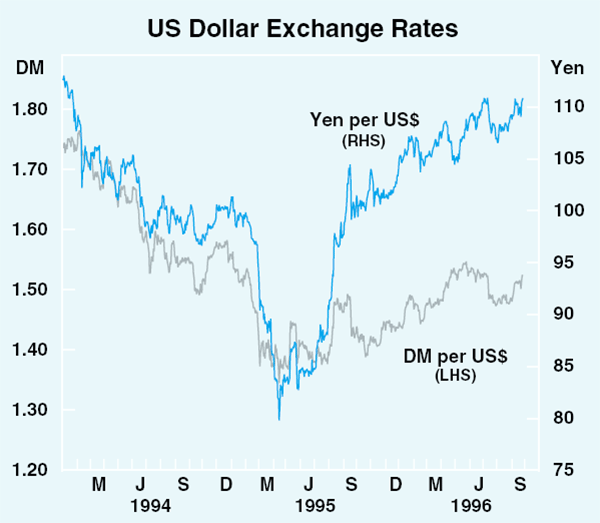
The German mark experienced a short period of renewed strength in August, notably against other European currencies. This was associated with heightened uncertainty over European Monetary Union, particularly whether certain core countries would meet the budget deficit criteria for monetary union by 1998. The instability was, however, relatively minor compared with past episodes, and shortlived. Overall, markets seem now to be more accepting than they were a year ago that EMU will proceed and, as noted above, the trend narrowing of bond yield differentials to Germany has continued for most countries.
The Australian Economy
Domestic activity
The recent erratic quarter-by-quarter sequence of estimates for growth in GDP has made it difficult to interpret underlying trends in the economy. According to the latest national accounts, GDP showed almost no growth in the June quarter, but this followed the increase of 2.0 per cent in the previous quarter. Over the year to the June quarter, GDP(A) grew by 4.5 per cent. This was boosted by the breaking of the drought, but even excluding the farm sector, output rose by 3.7 per cent (Graph 13). Recent indicators point to continued expansion in the September quarter, although business confidence remains patchy.
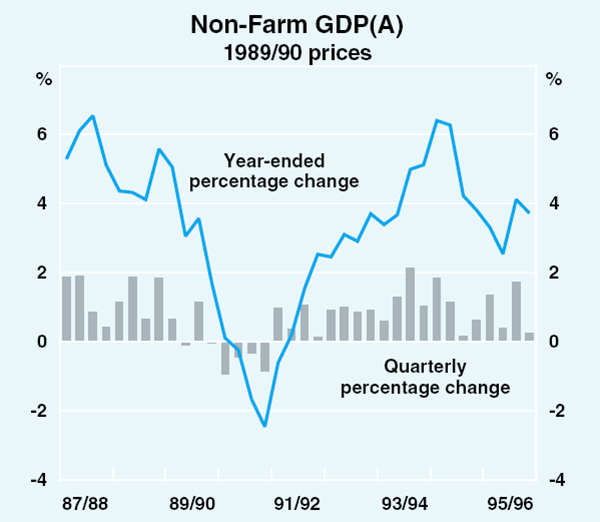
Looking behind the quarter-by-quarter variability of the national accounts figures, the economy seems to be growing somewhere around its long-term trend rate. The marked slowing recorded in the June quarter reflects some once-off factors. There was, for example, a sharp drop in government spending (which is often a volatile item) and the fall in exports followed an unusually strong surge in manufacturing exports in the March quarter. Looking ahead there are a number of factors which should provide on-going support to growth. Consumption is one, and the small rise in dwelling investment suggests that the contraction in housing may have now run its course. Notably, business investment continued to rise strongly, bolstering growth in the June quarter. Investment is traditionally important in determining the strength and profile of the cycle, and its continuing expansion will be a key element in maintaining overall growth.
| Year to June quarter | June quarter | ||
|---|---|---|---|
| 1995 | 1996 | 1996 | |
| Private consumption | 5.1 | 4.1 | 0.5 |
| Dwelling investment(a) | −9.1 | −13.4 | 0.6 |
| Business investment(b) | 14.8 | 12.0 | 2.7 |
| Government spending(b) | 3.7 | 0.9 | −2.2 |
| Stock building(c) | 0.8 | 0.5 | 0.8 |
| Exports | −0.4 | 13.3 | −1.1 |
| Imports | 13.6 | 9.0 | 2.8 |
| GDP(A) | 2.8 | 4.5 | 0.1 |
| Non-farm GDP(A) | 3.8 | 3.7 | 0.2 |
|
(a) Excludes real estate transfer expenses. (b) Excluding net second-hand purchases of assets between the private and public sectors. (c) Contribution to growth in GDP(E). |
|||
The household sector
Private consumption rose by 0.5 per cent in the June quarter, its smallest quarterly increase in two years. Early soundings for the September quarter suggest faster growth; in July and August, the average value of retail sales – which are around 40 per cent of private consumption – was 2 per cent higher than the average for the June quarter. Consumer confidence and credit also remain supportive of household spending. While the Westpac-Melbourne Institute's index of consumer sentiment fell by 5.4 per cent over the September quarter, to around its level at the time of the Federal election, it remains well above its long-run average (Graph 14). Personal credit is still growing strongly, although its recent acceleration is due partly to the financing of purchases of infrastructure bonds; excluding this factor, personal credit is estimated to have increased at an annualised rate of 13 per cent in the three months to August. Registrations of passenger vehicles have been highly volatile and difficult to interpret; if anything, they suggest some levelling-out in demand.
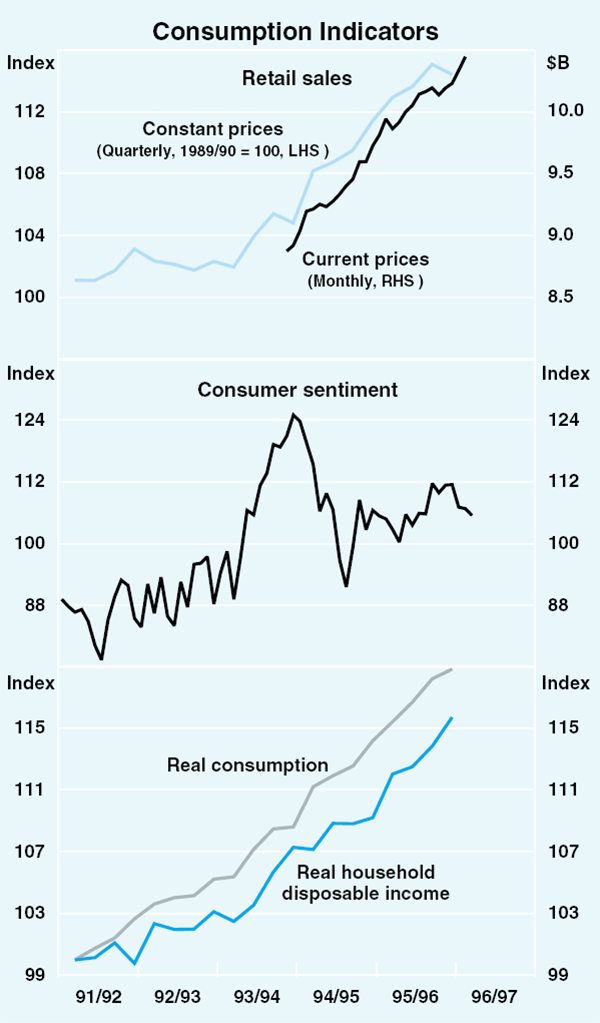
Growth in private consumption has outstripped growth in household disposable income since the mid 1970s, as reflected in the decline in the household saving ratio. Despite the upward revisions to estimates of household disposable income, the trend in the savings ratio is still down although the decline is now somewhat less pronounced, and may have begun to level out. Household saving in Australia remains extremely low by international standards.
Signs are clearer that a trough in the housing cycle has been reached. Reflecting rising expenditure on alterations and additions, dwelling investment rose by 0.6 per cent in the June quarter – a small increase, but the first quarterly rise since September 1994. Although dwelling commencements fell in the June quarter, this corrected an unexpected rise in the March quarter (Graph 15). The timing of the expected upturn in housing remains uncertain, with little evidence of a clear upward trend in the volatile monthly statistics on lending approvals and local government approvals to build.
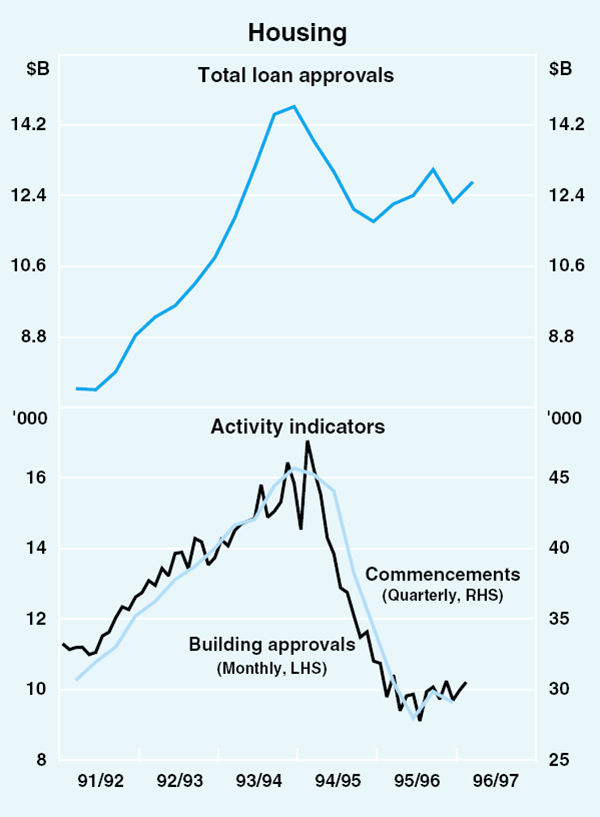
The dominant factor in the housing cycle continues to be the overhang of new dwellings constructed in the cyclical upswing. This is being reduced as the number of starts in the June quarter was again below underlying demand, as estimated by the Indicative Planning Council for the Housing Industry. Once this overhang is worked off, prospects for housing will improve. The CBA/HIA measure of housing affordability improved further in June, to its highest level in two years, reflecting the fall in mortgage interest rates. Mortgage interest rate reductions announced in August will further improve housing affordability and buoy sentiment. Conditions in the rental market and the market for existing dwellings differ across the country. In the two most populous States, vacancy rates are low, and house prices have recently increased. Elsewhere, conditions seem weaker.
The latest financial accounts indicate that the net financial position of the household sector (including unincorporated enterprises) remains sound. Net financial wealth increased by $2.5 billion during the June quarter, mainly reflecting rising share prices. Excluding valuation effects, net financial assets fell slightly as households acquired more debt. The gross financial wealth of the household sector increased by 8.1 per cent over the year to June.
The business sector
With business investment both an important component of demand and the basis for expanding productive capacity, and hence sustained growth, the factors influencing capital expenditure decisions are crucial to the outlook for the economy over the next year. So far, investment remains very positive, rising strongly through the first half of 1996, to a level 9.2 per cent higher than in the previous half year.
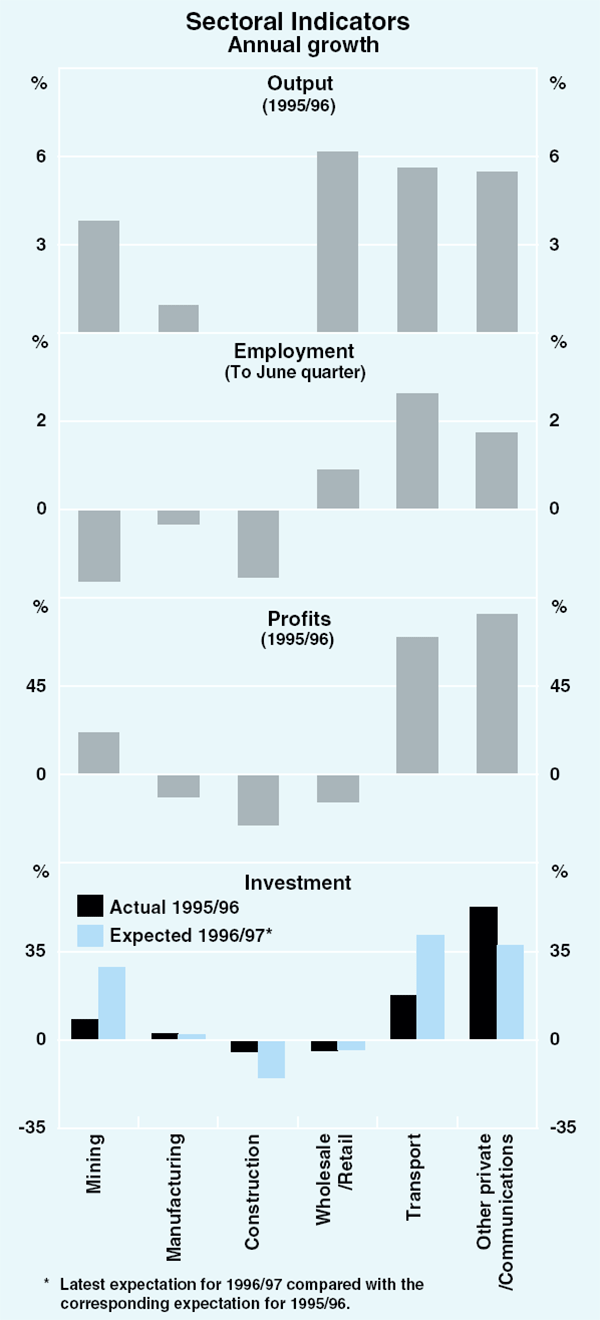
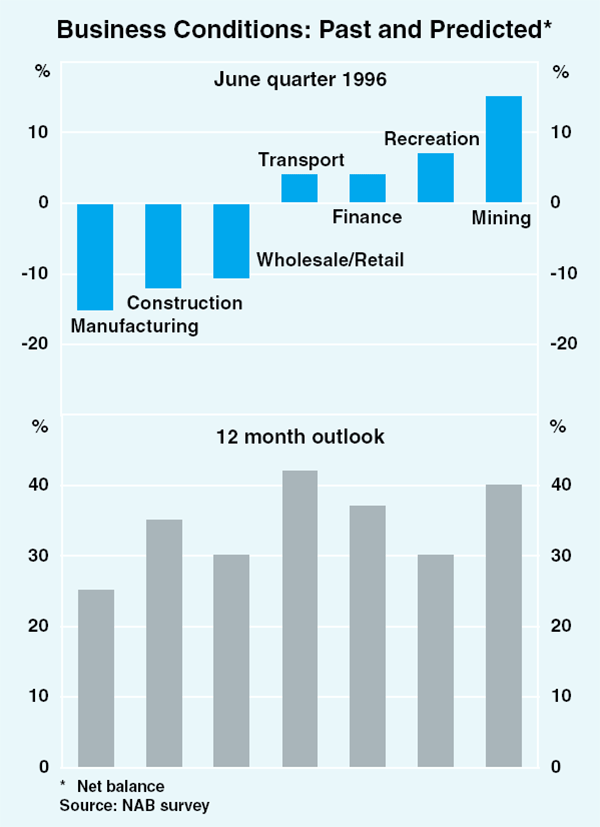
This strength in investment was maintained in spite of weak conditions in some parts of the economy in the first half of 1996. Output has slowed, with this slowing concentrated in manufacturing and construction (Graph 16). Manufacturers have adjusted production partly in response to slower demand (from the housing industry, and to shed the earlier build-up of stocks) and partly as a reaction to a wage/price squeeze, as producers found themselves caught between strong wage demands and very competitive product markets. The weakness in construction reflects the cyclical weakness in housing. Falls in profits have extended well beyond the manufacturing and construction sectors, suggesting that sales have been supported in some industries (notably wholesale and retail trade) at the expense of profit margins. The mining and some service sectors, such as financial and property services and communication, remain buoyant.
Respondents to the latest available NAB survey expect conditions to improve over the next year across all industries, including those which are currently most gloomy (Graph 17). The latest business surveys suggest some improvement in confidence, after the easing of monetary policy at end July and the Federal Budget in mid August.
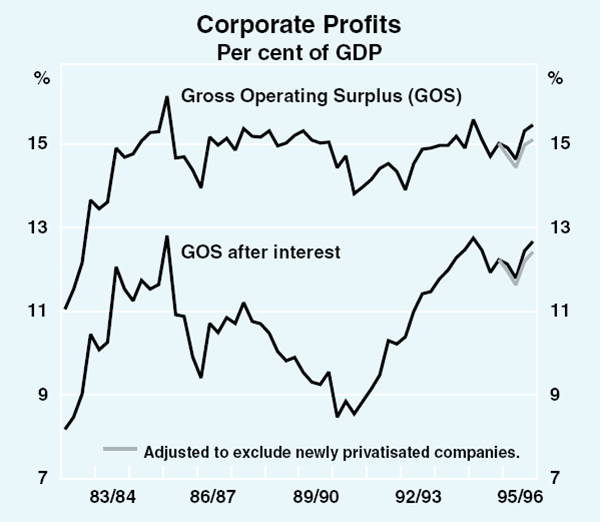
While profits have varied between sectors, in aggregate the corporate sector has performed well. Profits rose sharply in 1992/93 and 1993/94 and, having moved above their historical norm as a share of GDP, the slower expansion of profits of the past year was to be expected. Excluding profits of newly-privatised companies (Qantas and Victorian electricity companies), corporate profits, at about 15 per cent of GDP, are now estimated to be around their average of the past decade (Graph 18). Rates of return on total corporate assets remain near a decade high.
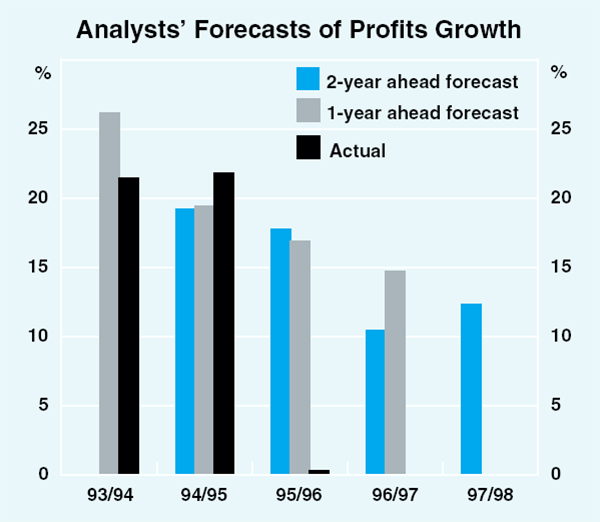
Although the economy-wide profit share is satisfactory (especially as calculated on an after-interest basis) and forecasts of overall profits are positive, there is a widespread perception that profits are poor. In part, this reflects the different sectoral performances: manufacturing is going through a lean period, while services, particularly finance, are performing strongly. There are also differences between companies listed on the stock exchange and non-listed companies, with some large high-profile companies performing worse than the average. Perhaps just as important, expectations of profit growth have not fully adapted either to the mature phase of the cycle or to the prevailing low-inflation environment. With corporate profits restored to their historical norms, they might now be expected to grow at around the same pace as nominal national income, thus keeping the corporate profit share roughly steady. But company analysts (and company managers) have continued to regard earlier growth rates as the norm, and are disappointed and surprised by lower outcomes (Graph 19).
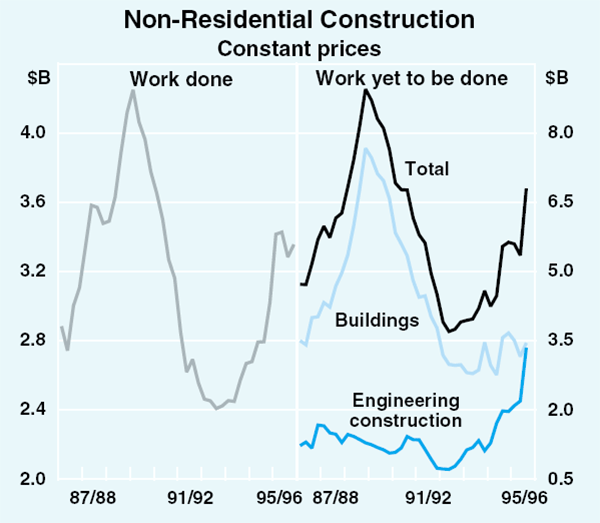
Expectations of improving conditions are reflected most strongly in intentions for capital spending. The latest Capital Expenditure Survey, which provides the third estimate of firms' investment plans for 1996/97, confirms earlier expectations of strong investment in the coming year (Graph 20). Growth is expected to be strongest in buildings and structures, with the latest estimate 28 per cent above the corresponding expectation for 1995/96. Other leading indicators of this type of investment also point to strength. Work yet to be done on buildings and structures in the March quarter (the latest statistics available) is about 85 per cent higher, in real terms, than in the trough of December 1992. This strength has come from engineering projects, especially construction of roads and mining-related projects (Graph 21). More recent statistics on approvals for non-dwelling construction have continued at a high level. The latest expectation for equipment investment is 10 per cent higher than the corresponding estimate for 1995/96 – still robust, but suggesting lower growth over the course of the year than in 1995/96. Investment intentions are strong in mining, property and business services, transport and storage and, especially, communications – industries in which profits have been high. Although they remain weak, the latest ACCI-Westpac survey points to some improvement in investment intentions in manufacturing.
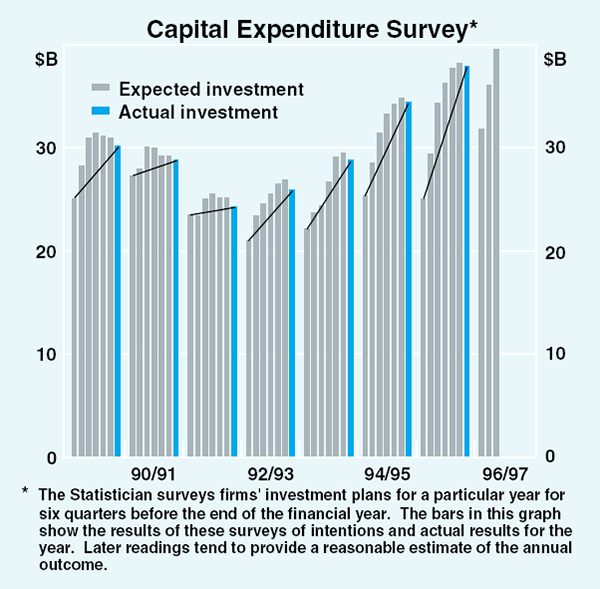
While the intentions statistics are useful in providing broad guidance about the outlook, the timing of spending on major projects is uncertain. A risk to the timing of the forecasts for investment is that work might be unexpectedly slow to start. The drop in imports of capital goods in the September quarter could be indicative of a delayed start, but it could also suggest that wholesalers' stocks of machinery and equipment were initially too high. Also, investment in building and structures, the expected mainstay of investment in 1996/97, has low import content.
Growth in business credit has eased, but remains ample to support growth in business activity, including the scale of investment projected. Excluding the estimated effects of privatisation of electricity companies, business credit grew at an annual rate of 9.9 per cent in the six months to August, compared with 12.7 per cent in the previous six months.
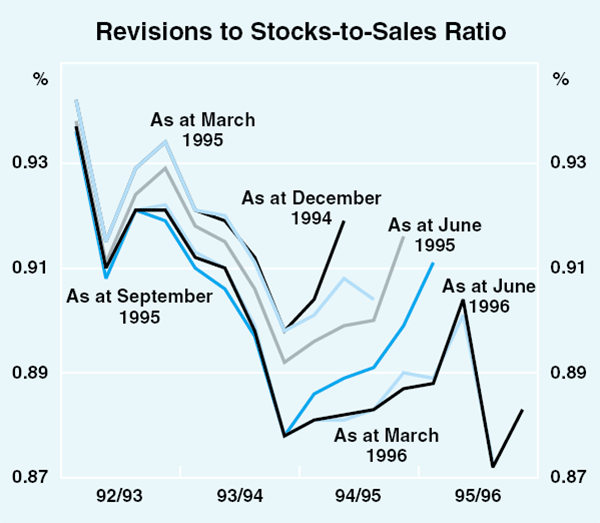
The stock cycle is often an important element in explaining the profile of the business cycle. Over recent years, however, its role has been difficult to assess because of successive substantial data revisions – since late 1992, the average absolute revision to quarterly estimates of the contribution of stocks to GDP has been as large as the average contribution of stocks itself (Graph 22). Judging from responses to surveys, businesses have had some difficulties over the past eighteen months in keeping stocks at their desired levels (and this has made production scheduling in manufacturing more difficult). Currently, there may still be excessive stock-holding in particular sectors, but overall levels seem to be broadly in balance with sales, suggesting that the need to shed inventories is unlikely to operate as a major drag on economic activity over the year ahead.
Public finance
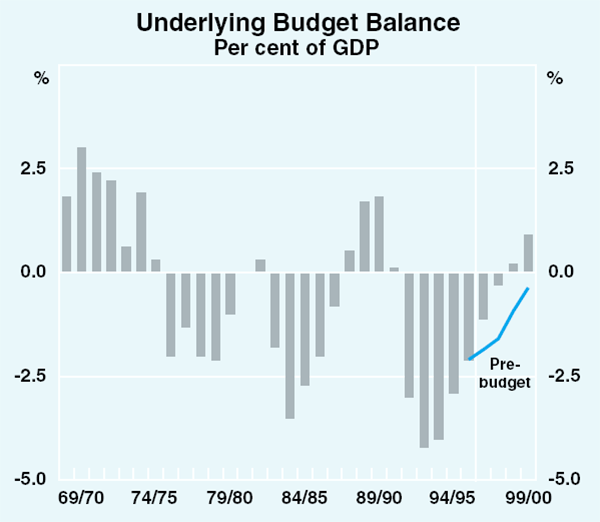
New measures contained in the Budget deliver net savings of $3.9 billion in 1996/97 and $7.2 billion in 1997/98. These savings were concentrated in measures to reduce outlays. Underlying deficits of $5.6 billion (1.1 per cent of GDP) in 1996/97 and $1.5 billion (0.3 per cent of GDP) in 1997/98 are projected, followed by surpluses in subsequent years (Graph 23). Both Commonwealth net debt and the underlying public sector borrowing requirement (PSBR) are expected to fall significantly over coming years. This should significantly increase the Commonwealth's contribution to national saving and help reverse the structural decline in public saving over the past two decades.
The Commonwealth Government has also committed itself to maintaining the Budget in underlying balance, on average, over the course of the economic cycle and announced details of a Charter of Budget Honesty, which promises greater transparency in the conduct of fiscal policy.
Budgets for 1996/97 of Victoria, Queensland and the Northern Territory, on the whole, contain significant increases in consumption spending and substantially higher capital outlays. Faster growth in consumption outlays is partly offset by a fall in debt interest payments in Victoria, reflecting the privatisation of electricity authorities, and by tax rises in Queensland. Increases in capital spending in Queensland will be funded largely by asset sales and other ‘once-off’ sources of funds.
Estimates based on the Commonwealth Budget and the round of State Budgets suggest that the underlying PSBR – that is, the PSBR adjusted for net advances – was 1.4 per cent of GDP in 1995/96, down from 1.9 per cent in 1994/95. Increased spending by the States and public-trading enterprises will have the effect of partly offsetting the Commonwealth's fiscal consolidation in 1996/97, so that the underlying PSBR is expected to fall to around 1 per cent of GDP – a reduction of less than ½ per cent of GDP, compared with a reduction in the Commonwealth Budget deficit of 1 per cent of GDP.
| 1995/96 | 1996/97 | 1997/98 | |
|---|---|---|---|
| Starting point | — | −9.6 | −8.7 |
| per cent of GDP | — | (−1.9) | (−1.6) |
| – outlay measures (net) | — | −2.9 | −5.2 |
| – revenue measures (net) | — | 1.0 | 2.0 |
| Budget balance | −10.3 | −5.6 | −1.5 |
| per cent of GDP | (−2.1) | (−1.1) | (−0.3) |
| (a) The underlying budget balance is measured as revenue less outlays (excluding net advances). Net advances consist of net policy lending and net equity transactions. | |||
The labour market
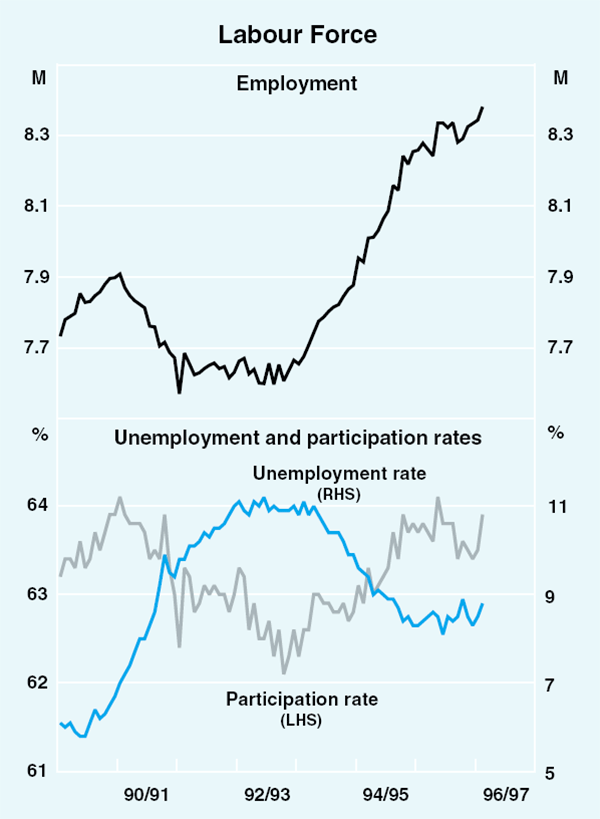
Although employment rose in the September quarter, the unemployment rate showed no improvement. Employment in August was 0.7 per cent higher than in May, with most of the rise in full-time workers, but the latest months have been slightly boosted by temporary workers conducting the Census.
Growth in employment has been restrained by the public-sector restructuring resulting from privatisations and the program of fiscal consolidation. Other labour-market indicators are consistent with continued moderate employment growth, although job vacancy statistics seem recently to have been heavily influenced by cutbacks in the public sector. In aggregate, the ABS measure of job vacancies fell by 1.2 per cent in the September quarter, but private-sector vacancies rose by 2.6 per cent, and by about 5 per cent over the year. The ANZ job vacancy series declined by 6.8 per cent over the three months to September, again possibly weighed down by fewer public-sector vacancies. Overtime fell in the September quarter. Business surveys suggest that short-term hiring intentions have become less pessimistic.
Notwithstanding recent growth in employment, the unemployment rate has shown no tendency to fall. There is considerable monthly volatility in this series: the rate fell from 8.9 per cent in April to 8.3 per cent in June, but then rose back to 8.8 per cent in August (Graph 24). Sluggish labour market conditions saw labour force participation fall earlier in the year, helping offset the effect on unemployment of weak employment growth. In August, labour force participation rose strongly on the back of the rise in both employment and unemployment.
The combination of subdued growth in employment and strong growth in measured output has produced substantial increases in labour productivity. Since the trough in output in mid 1991, private-sector labour productivity has grown at an average annual rate of 2 per cent. To an extent, this reflects the usual cyclical influences which boost productivity growth early in a recovery, but a structural improvement also seems apparent. Economy-wide labour productivity seems to be growing around a trend of 1¾ per cent a year during the current upswing compared with about ¾ per cent a year in the comparable period of the 1980s expansion.
The external sector
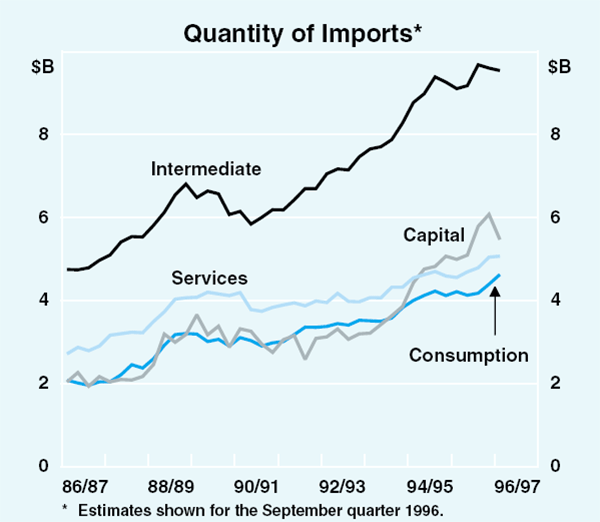
With strong growth in capital spending, the quantity of imports rose strongly in the first half of 1996. In the September quarter, however, the quantity of imports of goods is estimated to have fallen by 3 per cent. This fall has been concentrated in imports of investment goods, with the average value of capital imports in July and August about 17 per cent lower than in the June quarter. Imports of intermediate goods have also fallen (Graph 25). The drop in total imports is puzzling, partly because the rise in the exchange rate in the first half of 1996 might have been expected to spill domestic demand into higher imports. There is, however, some evidence of this in the case of imports of consumer goods, which have recently accelerated.
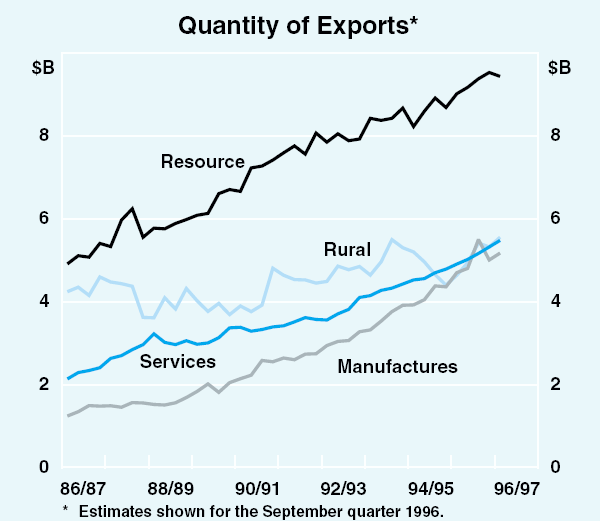
The quantity of exports fell by 1.1 per cent in the June quarter, mainly because manufactured exports had been exceptionally high in the March quarter (Graph 26). Exports are estimated to have risen a bit in the September quarter, with both rural and manufactured exports rebounding; net exports are likely to make a contribution to growth in GDP in the September quarter.
The fall in export prices in the June quarter was smaller than in import prices and the terms of trade rose by 2.0 per cent. The terms of trade increased by 5.2 per cent over the year, reflecting stronger world commodity prices.
The strength of exports in 1995/96, the improvement in the terms of trade and a marked slowing in growth in imports contributed to a narrowing in the deficit on trade in goods and services. This was partly offset by a rise of more than $1 billion in the net income deficit. The current account deficit nevertheless fell to $20.3 billion (4.2 per cent of GDP) in 1995/96, from $27.6 billion (6.1 per cent) in 1994/95. Largely reflecting the fall in imports, the current account deficit fell in July and August to a quarterly rate of around $4 billion, compared with about $5 billion in the June quarter.
Australia's net foreign liabilities rose by $23.8 billion to almost $285 billion (58.6 per cent of GDP) over 1995/96. The main factor was an increase of 23 per cent in net foreign equity; net foreign debt outstanding grew by 3.2 per cent. In line with reduced reliance on foreign debt, the debt servicing ratio remains well below recent peaks, at 11.3 per cent of exports of goods and services. Net income payable on equity investments has been increasing with the rise in net foreign equity, to 7.3 per cent of exports of goods and services in the June quarter.
Australian Financial Markets
Australian financial markets have been driven more by factors specific to Australia than international forces over recent months. While long-term interest rates in many countries have been steady or fallen, Australian bonds have fallen significantly further than those in most other markets, and spreads have narrowed appreciably. This trend reflects the confluence of several positive influences, including improving prospects for inflation, the easing of monetary policy in late July and the bringing down of the Commonwealth Budget. Despite lower interest rates, the exchange rate has remained relatively steady, ending September little changed from three months earlier, after a sharp but temporary decline around the time of the monetary policy change.
Capital markets
Market participants reacted favourably to the easing in monetary policy on 31 July, and, as often happens, began to anticipate that further moves in the same direction could follow in due course. The bringing down of the Budget, with the prospect of a restoration of public and national saving over time, contributed to the ‘positive outlook’ for Australia's credit rating announced by the ratings agency Standard and Poor's. The Standard and Poor's announcement itself further improved market sentiment.
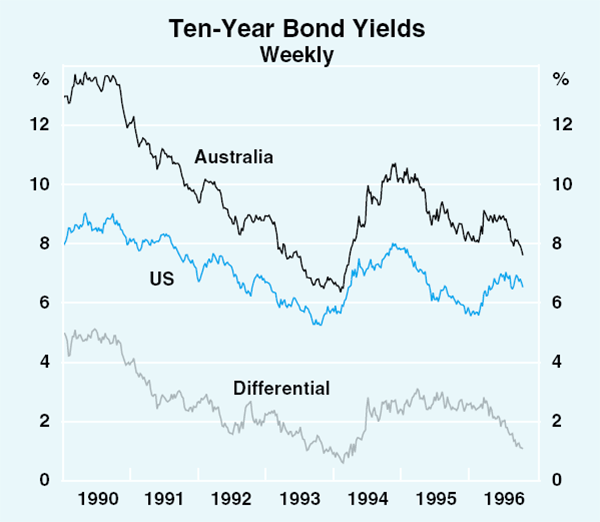
This provided a very bullish environment for Australian bonds, and there was a fairly substantial decline in yields, from around 9 per cent at the end of June to about 7.5 per cent three months later (Graph 27). With US yields little changed over the same period, the spread between Australian and US yields has narrowed to around 100 basis points, down from around 200 basis points at the end of June and over 250 basis points earlier in the year. Spreads have also narrowed against other major countries. These lower borrowing rates, providing they can be sustained, will result in significant savings to both government and private borrowers.
| Australia less | End December 1995 | End June 1996 | 8 October 1996 |
|---|---|---|---|
| United States | 257 | 205 | 103 |
| Germany | 214 | 228 | 157 |
| Japan | 528 | 568 | 481 |
| Canada | 111 | 115 | 78 |
| New Zealand | 95 | 18 | −44 |
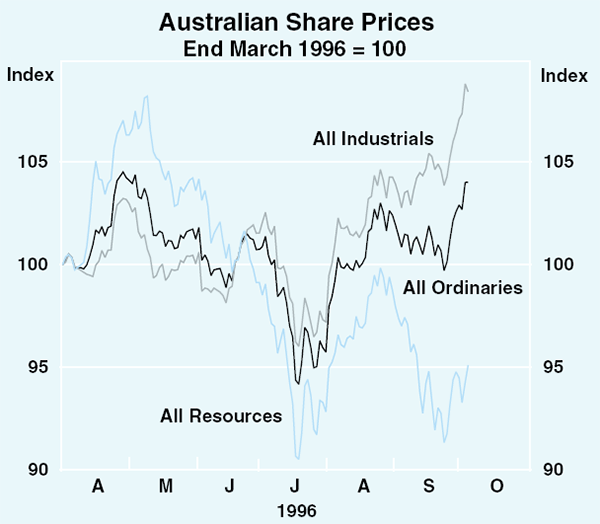
Australian share prices fluctuated with movements in the US market over the past few months, although in general, the Australian market has failed to gain as much as in the US (Graphs 10 and 28). The main reason for this has been the poor performance of resource stocks, reflecting weakness in commodity prices and growing pessimism about their medium-term prospects. In contrast, industrial stocks continued to move higher, buoyed by the stronger bond market. The net result is that the All Ordinaries index has risen by around 4 per cent over the past few months.
Foreign exchange market
The Australian dollar has stabilised at around US79 cents, or about 58 on the trade-weighted index (TWI) over recent months, having appreciated during the first four months of 1996. It experienced a brief sell-off at the end of July, as a result of the monetary policy adjustment. The currency fell by around US1 cent immediately prior to the easing, by which time speculation about a rate cut had become widespread. After the announcement, it fell about another cent, reaching a low of around US77 cents. It was well supported at this level, however, and over the next few weeks moved back up to the level it had been at before the easing, where it has remained.
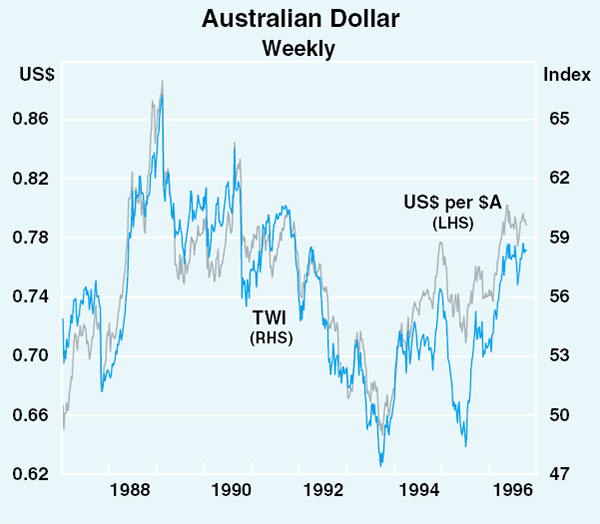
A generally favourable reaction to the Budget and the Standard and Poor's announcement also helped support the currency. Interest rate differentials are also still favourable, although less so than was the case some months ago. Demand by Japanese investors for higher-yielding paper in a number of countries, including Australia, has continued to be strong.
The Bank has continued to purchase foreign currency to meet the needs of the Commonwealth Government. It has also taken the opportunity on occasions of strength in the exchange rate to make modest purchases for its own account, reversing some of the sales of foreign exchange undertaken to support the Australian dollar during 1992 and 1993. In total, the Bank made spot purchases of foreign exchange in the local market amounting to $A1.2 billion during the September quarter, of which $A0.3 billion was on-sold to the Commonwealth.
Financial intermediaries
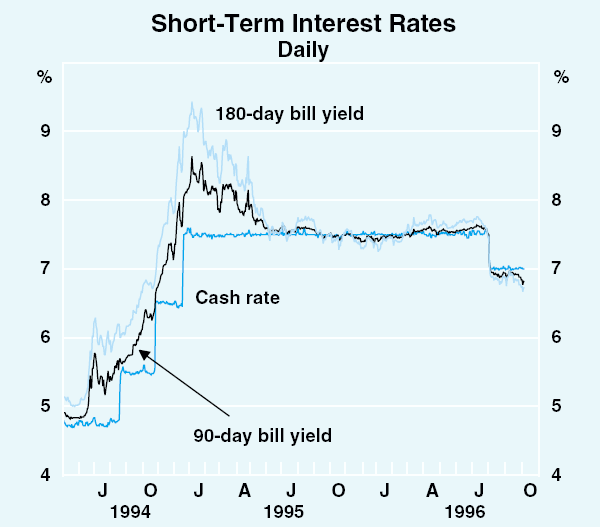
The easing in monetary policy at the end of July had a marked impact on domestic short-term interest rates and on rates charged by financial intermediaries. After sitting just a little above the cash rate during most of 1996, short-term interest rates – such as those on 90-day bills – moved sharply lower following the monetary policy announcement (Graph 30). Perceptions quickly spread that the economic outlook remained favourable for a further easing and markets moved to factor in another easing later in the year. Short-term interest rates currently indicate expectations of another 50 basis point fall in the cash rate by the end of 1996.
Following the reduction in the cash rate in late July, most intermediaries announced cuts to housing and business loan rates, and fixed deposit rates, by a similar amount (Graph 31). The predominant standard variable housing loan rate stands at 9.25 per cent, effective for new borrowers from early August, and for most existing borrowers from late September. Together with the response by banks to increased competition in June, this brings the reduction to around 1.25 percentage points over recent months.
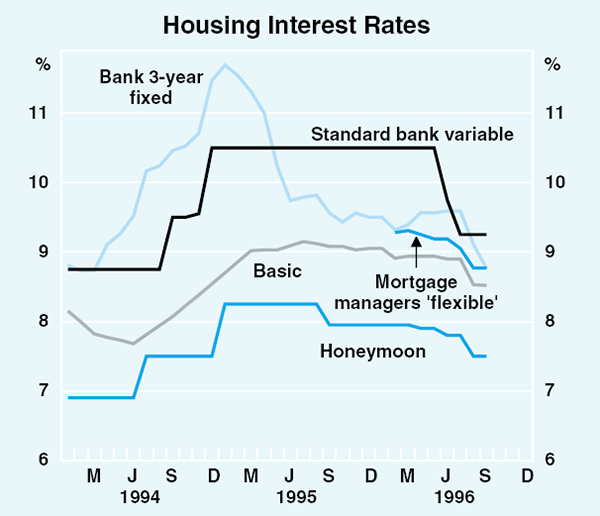
The flow-through to basic (‘no frills’) loans by mortgage managers and banks has also occurred quickly with rates falling by an average of 40 basis points to 8.5 per cent. Honeymoon rates were also cut, by about 50 basis points, to 7.4 per cent. In line with the falls in longer-dated yields, average rates on fixed-rate housing loans have declined – over the quarter the rate on a 3-year fixed-rate loan, for instance, is down 80 basis points to 8.8 per cent, about 1.5 percentage points above the marginal cost of funds.
Rates on business loans have also been cut. The small business indicator rate was reduced 50 basis points to 10.75 per cent, effective between late August to mid September. Base interest rates on bills and fixed-rate business loans also fell.
Financial aggregates
Growth in currency slowed in the three months to August to bring growth over the six months to August to an annual rate of 2.4 per cent. Over the six months to August, broad money grew at an annual rate of 9.4 per cent, down from 11.5 per cent over the six months to February. In part, the slowing in this aggregate reflects financial institutions' continued use of net foreign liabilities to supplement domestic deposits in funding lending activity; banks' net foreign borrowing rose by $5.6 billion over the June quarter.
Some moderation in growth in total credit is evident over the past six months. The moderation partly reflects less credit raised to fund privatisations, partially offset by a surge in personal credit used to purchase infrastructure bonds. Corporate balance sheets remain in good shape with high rates of cash flow in most industries. Although corporates have shown greater inclination to fund expansion by debt rather than equities over the past year, corporate gearing ratios, in aggregate, remain well below the peak of the early 1990s, and show only a minor tendency to rise. Continued growth in credit is consistent with continuing growth in economic activity and business expansion.
| 3 month annualised rate | 6 month annualised rate | |||
|---|---|---|---|---|
| May 1996 | August 1996 | February 1996 | August 1996 | |
| Broad Money | 6.1 | 12.7 | 11.5 | 9.4 |
| Currency | 2.5 | 2.4 | 3.4 | 2.4 |
| M1 | 13.6 | 10.0 | 14.5 | 11.8 |
| M3 | 4.4 | 13.5 | 10.7 | 8.9 |
| 3 month annualised rate | 6 month annualised rate | |||
|---|---|---|---|---|
| May 1996 | August 1996 | February 1996 | August 1996 | |
| Total Credit | 11.3 | 11.7 | 14.8 | 11.5 |
| Business | 11.9 | 10.4 | 18.8 | 11.1 |
| Housing | 11.2 | 10.4 | 12.0 | 10.8 |
| Personal | 8.9 | 22.6 | 7.4 | 15.5 |
Inflation Trends and Prospects
Trends in labour costs
The moderation in economy-wide wages growth is not yet evident in new enterprise bargains, raising concerns that wages growth might accelerate when labour market conditions begin to tighten.
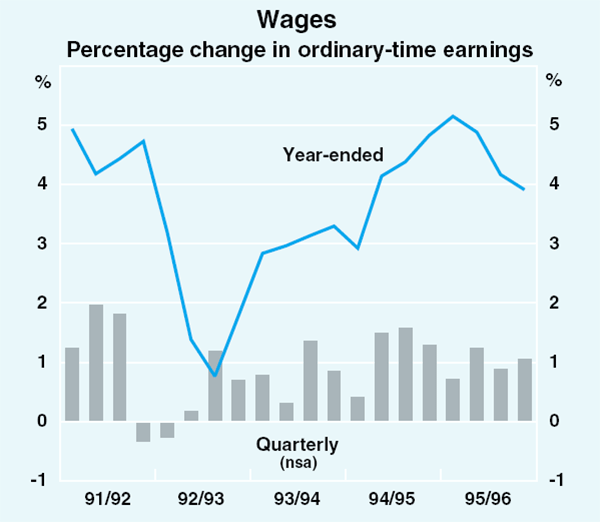
Average weekly ordinary-time earnings of adults working full time (AWOTE) has provided the most reliable guide to recent trends in wages growth; it seems to have been less affected by compositional changes in the labour force than broader measures of average earnings. AWOTE increased by 1 per cent during the three months to May 1996, and by 3.9 per cent over the year. This compares with growth of 5.1 per cent over the year to August 1995, when wage pressures were stronger (Graph 32). The moderation is most evident in the private sector, where growth in ordinary-time earnings has slowed from rates above 6 per cent to 4.4 per cent over the year to May. Over the year to May, public-sector AWOTE rose by 3.4 per cent, up from 3.1 per cent over the year to February.
The broader measure of wages – average weekly earnings of all employees (AWE) – increased by 3.0 per cent over the year to May. These statistics have recently been affected by an implausible fall in the share of full-time workers recorded in the AWE Survey, which has depressed growth of AWE. Adjusting the statistics to reflect the full-time employment share from the Labour Force Survey, AWE has been increasing at a rate comparable with AWOTE. Increased superannuation costs are estimated to have contributed an additional ½ percentage point to growth in total labour costs over the past year. Since additional compulsory employer contributions will apply only to firms with small payrolls, this effect should decline over the next year.
Slowing in the economy-wide measures of earnings in the past year seem largely to reflect the influence of the cyclical pause in employment growth. New settlements are yet to show evidence of slowing. Figures from the Department of Industrial Relations (DIR) show that new federal enterprise agreements registered in the June quarter contained average wage rises of 5.6 per cent a year, up from 4.7 per cent in the March quarter. The DIR estimates that private-sector agreements contained average increases of 6.6 per cent a year in the June quarter, up from 5.1 per cent in the previous quarter. This acceleration reflected the inclusion of recent high settlements of major banks. In the Bank's view, the DIR's approach to calculating the duration of agreements has had the effect of overstating wage settlements in the banking sector. Making an allowance for this effect, the Bank's estimate is that new private-sector enterprise agreements in the June quarter contained average wage increases of 5.6 per cent a year (Graph 33).
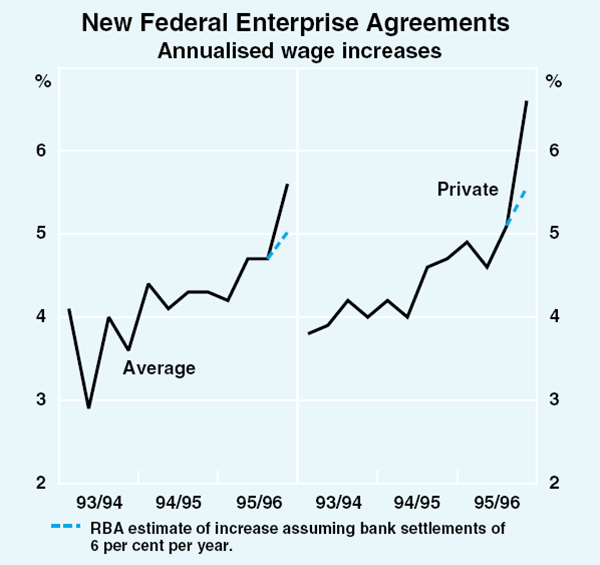
The result of continuing high settlements in new enterprise agreements is that average wage rises contained in all currently active agreements have been rising. The DIR estimates that all currently active enterprise agreements contain average wage rises of 4.7 per cent a year, compared with 4.0 per cent in the June quarter of 1995.
Earnings growth for skilled occupations also remains high. The Cullen Egan Dell survey of skilled employees reported that executive salaries grew by 6.3 per cent over the year to the June quarter. Growth in non-executive remuneration appears to have stabilised at around 4½ per cent.
Enterprise deals at the current rate give cause for concern that the recent moderation in aggregate wages might not be sustained. One characteristic of the AWOTE data is that they strongly reflect – with some lag – the cycle and state of the labour market: in 1995, for example, AWOTE rose more quickly than enterprise bargains. While AWOTE is currently consistent with the 2–3 per cent inflation objective, this reflects the modest growth in employment of the past year: the forward-looking concern is that, with employment growing more strongly, AWOTE would once again be running at a pace which threatens price stability.
With pockets of weakness in profits, falling inflation and a flat unemployment picture, some fall in wage settlements contained in new enterprise bargains might already have been expected. Moderation might yet become apparent, although the transition to a more deregulated labour market poses the risk that efforts to restore traditional wage relativities might also raise aggregate wages growth. Prospective low rates of inflation should provide a climate conducive to a higher degree of wage restraint.
Recent developments in inflation
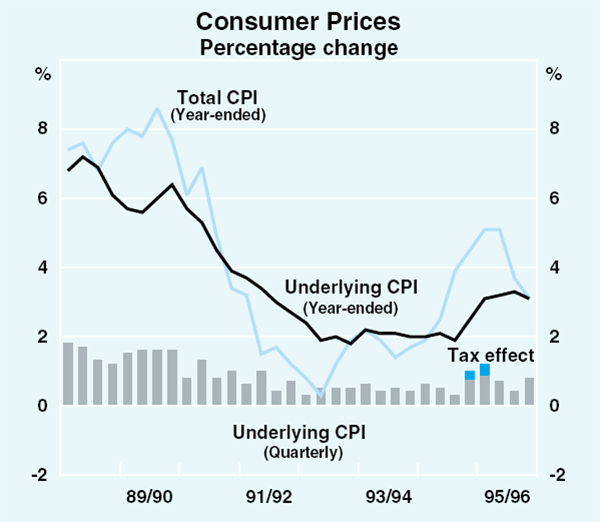
In underlying terms, consumer prices increased by 0.8 per cent in the June quarter, and by 3.1 per cent over the year to June (down from a peak of 3.3 per cent in the year to March 1996).
The headline CPI rose by 0.7 per cent in the June quarter, bringing the year-ended rate also to 3.1 per cent, compared with a peak of 5.1 per cent in the December quarter (Graph 34). The large fall mainly reflects earlier increases in mortgage interest rates ‘dropping out’ of the year-ended calculation.
Broader national accounts measures confirm that annual rates of inflation have fallen. Over the year to June, the deflator for GDP rose by 2.3 per cent, while that for private final demand rose by only 1.3 per cent. The implicit and fixed-weight consumption deflators rose by 2.0 per cent and 1.8 per cent over the year to the June quarter.
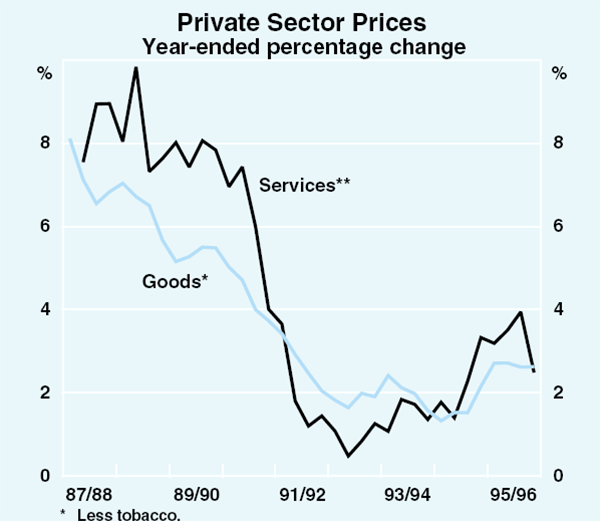
The higher level of the Australian dollar has helped contain growth in the final retail prices of imports, adding to pressure on domestic retailers and wholesalers to cut margins. In particular, import competition and cheaper imported inputs have kept goods prices subdued. The service sector is highly labour-intensive and typically subject to less discipline from international competition; consequently, wage pressures tend to have larger sway on prices in this sector. With wages having grown quickly in 1994/95, service prices had been rising faster than goods prices for some time. This gap closed in the June quarter (Graph 35).
| March quarter |
June quarter |
Over latest three months |
Year to latest(a) |
|
|---|---|---|---|---|
| Consumer Prices | ||||
| Consumer price index (CPI) | 0.4 | 0.7 | — | 3.1 |
| Underlying CPI | 0.4 | 0.8 | — | 3.1 |
| Private sector goods & services(b) | 0.5 | 0.7 | — | 2.8 |
| Fixed-weight private consumption deflator | 0.4 | 0.2 | — | 1.8 |
| Producer Prices | ||||
| Final manufacturing prices(c) | ||||
| – domestic | 0.2 | −0.1 | 0.0 | 0.6 (July) |
| – imported | −1.6 | −4.0 | −1.8 | −11.4 (July) |
| Intermediate manufacturing prices(c) | ||||
| – domestic | 0.0 | −0.6 | −0.5 | −1.8 (July) |
| – imported | −1.1 | −3.8 | −3.1 | −7.3 (June) |
| Raw materials(c) | −1.9 | −0.8 | 1.9 | −6.4 (June) |
| Import Prices | ||||
| Import price index(c) | −1.6 | −3.8 | −2.1 | −10.1 (July) |
| Imported component of CPI | −0.1 | 0.3 | 0.3 | 0.5 |
|
(a) In the year to the June quarter 1996, or to the month shown. (b) Excluding tobacco. (c) Excluding petroleum. |
||||
Wholesale prices and margins
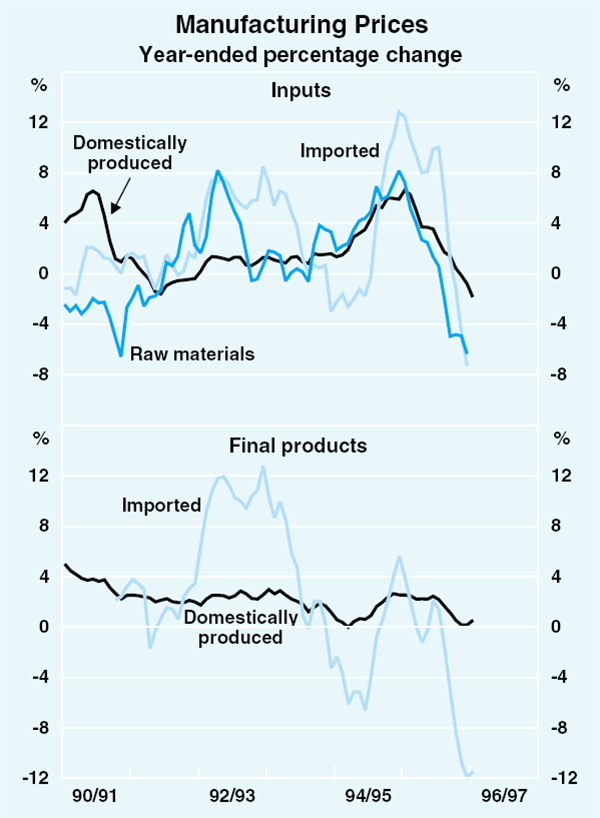
The impact of the stronger exchange rate in 1996 is showing in wholesale prices, which are currently exerting virtually no upward pressure on final consumer prices. Prices of raw material inputs have fallen almost continuously for the past year, and are growing at their lowest annual rate for almost five years; rises in prices of intermediate inputs have also slowed markedly; and prices of imports have fallen. Reflecting these influences, the price of domestically produced final manufactured goods grew by only 0.6 per cent over the year to July (Graph 36).
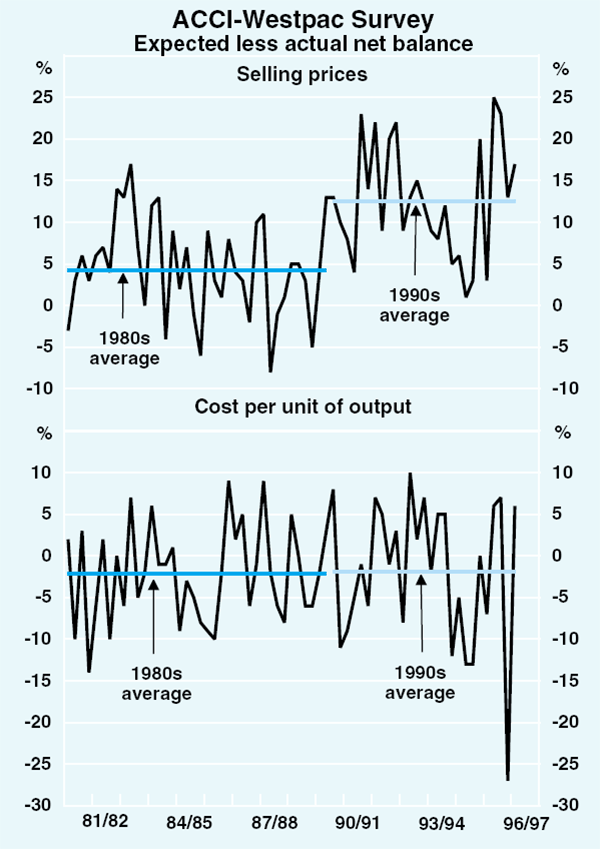
Business surveys also show a reduction in ‘pricing power’, particularly in the manufacturing, wholesale and retail sectors. According to the ACCI-Westpac survey, a net proportion of 12 per cent of manufacturing firms cut prices in the September quarter.
A feature of the low-inflation environment of the 1990s is that businesses have consistently over-estimated their ‘pricing power’: they have been significantly less successful in achieving their expected price rises than in the 1980s. According to the ACCI-Westpac survey, over the 1990s the net proportion of firms expecting to raise prices (in the subsequent quarter) has exceeded the net proportion which have managed to do so by around 13 per cent; the comparable figure for the 1980s was around 4 per cent (Graph 37). This suggests that firms have not yet fully adjusted their expectations to take account either of low inflation or the more competitive business environment. As in the 1980s, firms' costs have continued to come in much as expected, suggesting that firms have agreed to wage increases in the 1990s on the basis of overly optimistic expectations of the potential for price rises. This would be consistent with unexpected increases in real wages, leading to sluggish growth in employment and profits.
Inflation expectations
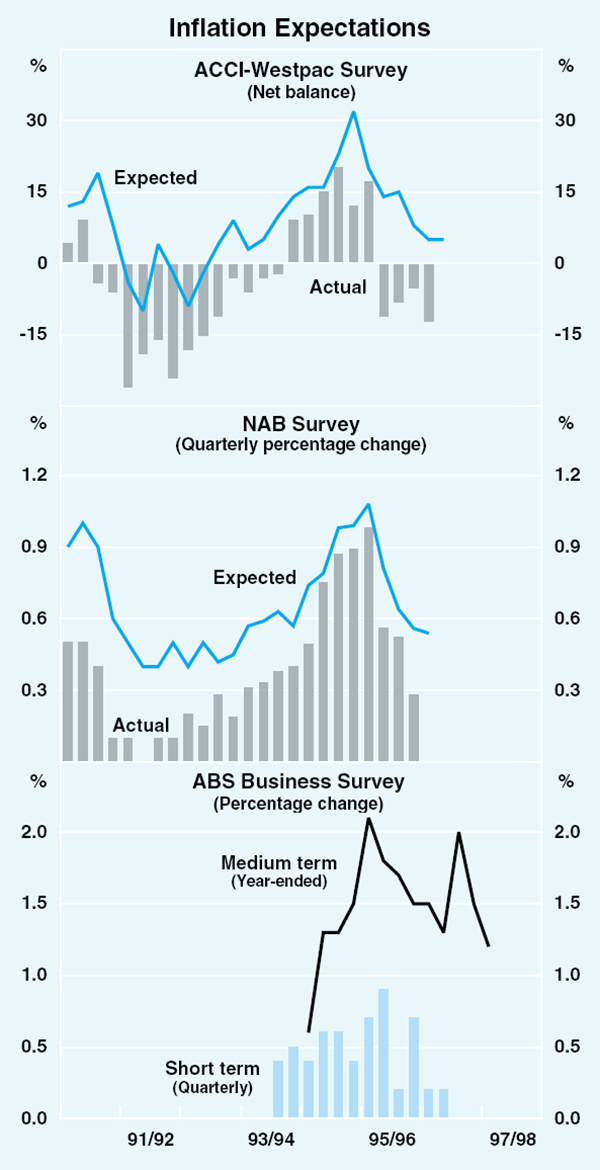
Slower growth in economic activity, falling inflation and the firm exchange rate have seen inflation expectations recede. This is most clearly evident in business surveys (Graph 38). The Statistician's economy-wide survey of business expectations suggests continuing low price pressures in the December quarter, even allowing for the tendency of this survey to understate recorded price rises. In the latest ACCI-Westpac survey, a net balance of 5 per cent of manufacturing firms expect to raise prices in the December quarter, a low level by historical standards; as noted, these respondents consistently overestimate the potential to raise prices. Over the next year, respondents to the Statistician's survey expect selling prices to rise by 1.2 per cent, the lowest expectation since the statistics collected in the September quarter of 1993. Retail businesses see the potential to raise prices as particularly limited.
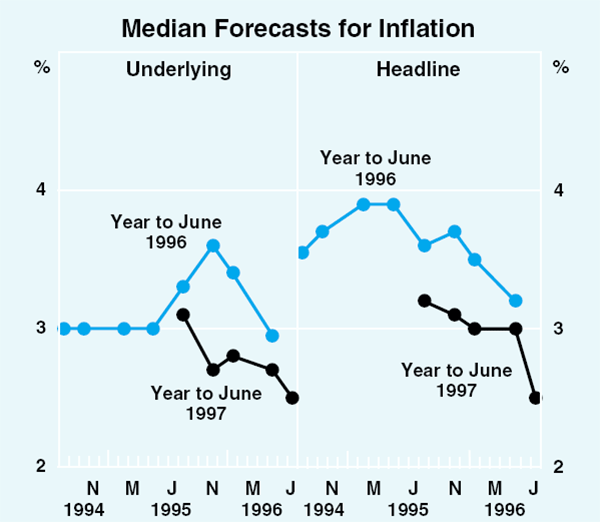
Financial market economists, surveyed by the Bank in July, have lowered their inflation forecasts (Graph 39). The median forecast for underlying inflation over the year to June 1997 is 2.5 per cent, down from 2.7 per cent in the previous survey. The median forecast for headline inflation over the year to June 1997 is also 2.5 per cent, down from 3.0 per cent in the previous survey; these forecasts for headline inflation were collected ahead of the second round of reductions in mortgage interest rates announced early in August. The median forecast for underlying inflation in the year to June 1998 is 3.0 per cent, with headline inflation expected to be slightly higher.
Measures which look beyond the next year or so are also encouraging. According to the NAB survey, a majority of respondents now expect inflation to average between 3 and 4 per cent over the remainder of the decade, and the proportion expecting inflation to exceed 4 per cent has fallen sharply. While these results are shifting in the right direction, they are consistent with the perception that many people are building into their decisions inflation rates higher than 2–3 per cent. Some would see this as sensible conservatism in an uncertain world, but as those who have built over-estimates of inflation into their wage negotiations have found, the results can be costly.
Inflation outlook
In the near term, the Bank expects a continuation of modest price increases, reflecting two main factors:
- continued competitive restraint on firms' margins; and
- the lagged effects of the earlier exchange rate appreciation.
In the September quarter, tax rises which added 0.3 of a percentage point to underlying inflation in the September quarter 1995 will ‘drop out’ of the year-ended rate. Partly for that reason, underlying inflation should fall into the 2–3 per cent range, and possibly into the lower half of the target band during 1996/97. Headline inflation will fall clearly below the underlying rate, as recent reductions in mortgage interest rates are expected to reduce the headline rate in the September, December and March quarters by a total of around ¾ of a percentage point. The only adverse factor in sight which might affect headline inflation is the recent rise in international oil prices; this may well turn out to be temporary.
Beyond 1996, if the trade-weighted exchange rate were to remain around its current level of about 58, it would provide fewer further disinflationary benefits. With the pace of employment growth expected to quicken over the coming year, some acceleration in labour costs might be expected, and businesses may attempt to restore margins. Pressures are likely to be in the direction of rising inflation, and underlying inflation might retrace towards 3 per cent by mid 1998.
Labour costs present the main risk to this profile. Sustaining low inflation as employment gathers strength will require moderation in wage demands, especially in new enterprise agreements. Risks on labour costs also come from changes to the industrial relations framework and the ‘Living Wage’ claim, although it is impossible to predict what effects these might ultimately have on wages.