Speech Risk and Return in a Low Rate Environment
Today I am going to talk about some issues around risk and return in a low rate environment, in line with the theme of the conference. I am going to highlight questions that strike me as worth asking about the way return and risk are reflected in the current configuration of asset prices. I will suggest some considerations worth thinking about in trying to answer those questions from the investor side. I will also describe how issuers have adjusted their strategies to avail themselves of the low rate environment.
One of the main points I would like to make is that the low interest rate structure underpins many asset prices. That is, asset prices which might look expensive are more reasonably priced given that the rate structure currently is at historically low levels. So in my view, a fundamental question that you need to think about as an investor is: will the current rate structure remain at these levels, or will it return to the higher levels we have seen in the past? If the rate structure remains near historic lows, then valuations can persist. But if it rises, then asset valuations need to be reassessed. The second and related question is: what is the risk that such a shift in the rate structure occurs and am I being adequately compensated for that risk?
Low Interest Rates
I am going to use the rate structure in the US, and particularly the yield on a US 10-year Treasury bond to illustrate the shift in the rate structure (Graph 1).
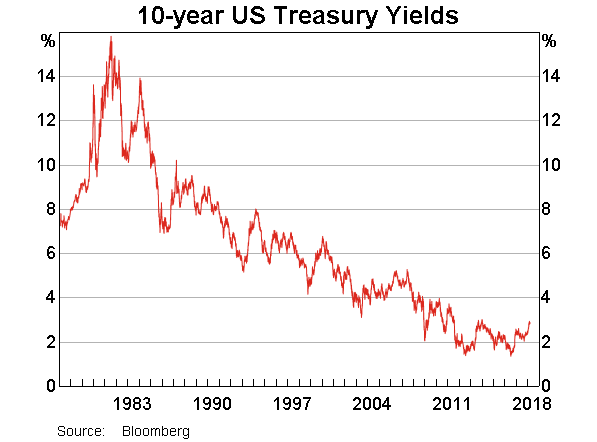
As you are all aware, in the wake of the financial crisis and the sharp decline in global growth and inflation, monetary policy rates round the world were reduced to historically low levels. In a number of countries (Australia being one notable exception), the policy rate was lowered to its effective lower bound, which in some cases was even in negative territory.
In part reflecting the low level of policy rates and the slow nominal growth post crisis, long-term bond yields also declined to historically low levels. 10-year government bond yields in some countries, including Germany, Japan and Switzerland have been negative at various times in recent years. In 2015, over US$14 trillion of sovereign paper had negative yields.
For the past decade, the yield structure in the US has been lower than at any time previously. Let me put in context the current excitement about the 10-year yield in the US reaching 3 per cent. In the three decades prior to 2007, the low point for the yield was 3.11 per cent.
All this goes to say that we have been living in a period of unusually low nominal bond yields. How long will this period last?
One way to think about this question is to ask whether what we are seeing is the realisation of a tail event in the historical distribution of interest rates.[1] While this tail event has now lasted quite a long time, if you thought it was a tail event, then you would expect yields to revert back to their historical mean at some point. You also wouldn't change your assessment of the distribution of future realisation of interest rates.
On the other hand, it might be the case that the yield structure has shifted to a permanently lower level because of (say) secular stagnation resulting in structurally lower growth rates for the major economies for the foreseeable future. If this were the case, you would change your assessment of future interest rate outcomes.
I don't know the answer to this question, but it has material implications for asset pricing.
As I said earlier, the prices of many assets could be broadly validated if you believe the low rate structure is here to stay.[2] This is because the lower rate structure means that the rate with which you discount expected future returns on your asset is lower and hence the asset price is higher for any given flow of future earnings.
The current constellation of asset prices seems to be based on the view that the global economy can grow strongly, with associated earnings growth, but that strong growth will not lead to any material increase in inflationary pressure.[3]
You might want to question how long such a benign conjuncture could last. Current asset pricing suggests that the (average) expectation of market participants is that it will last for quite a while yet.
It is also worth pointing out that it is possible that a move higher in interest rates occurs alongside higher expected (nominal) dividends because of even higher real growth. If this were to occur it would not necessarily imply that asset prices have to adjust. It would depend upon the relative movements in earnings expectations and interest rates; that is, the numerator and denominator in the asset price calculation.[4]
How might we know whether the distribution of interest rates has shifted? One can think of the interest rate distribution as being anchored by the neutral rate of interest. I talked about this in the Australian context last year.[5] As I said then, empirically the neutral rate of interest is difficult to estimate. It is even harder to forecast. The factors which affect it are often slow moving. But sometimes they aren't, most notably around the time of the onset of the financial crisis in 2007-08, when estimates of the neutral rate declined rapidly and significantly. Currently, there is a debate in the US as to whether the neutral rate of interest has bottomed and is shifting up. This raises the question as to the degree and speed with which such a movement in the neutral rate in the US might translate globally.
All of these questions highlight to me the inherent uncertainty about the future evolution of interest rates. One might decide that interest rates are going to continue to remain lower for longer, but I struggle to see how one can hold that view with any great certainty. Yet there appears to me to be very little, if any, compensation for this uncertainty in fixed income markets. Most estimates of the term premium in the 10-year US Treasuries are around zero, or are even negative (Graph 2). Investors are not receiving any additional compensation for holding an asset with duration.
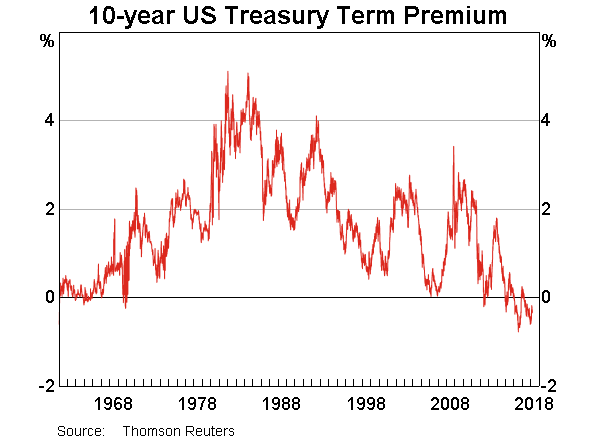
That is, one can have different views about the longevity of the current rate structure.[6] But, in part reflecting these different views about longevity as well as the unusual nature of the current environment, there is a significant degree of uncertainty about the future. Yet many financial prices do not obviously offer any compensation for that uncertainty.
Low Volatility
It's not only in the term structure of interest rates where compensation for uncertainty is low. Measures of implied volatility indicate that compensation for uncertainty about the path of many other financial prices is also low, and has been low for some time. This has been true across short and long time horizons, across countries, including Australia, across asset classes, and across individual sectors within markets (Graph 3 and 4). I will discuss some of the possible explanations for this, drawing on material published in the RBA's February Statement on Monetary Policy, and also discuss the recent short-lived spike in volatility in equity markets.
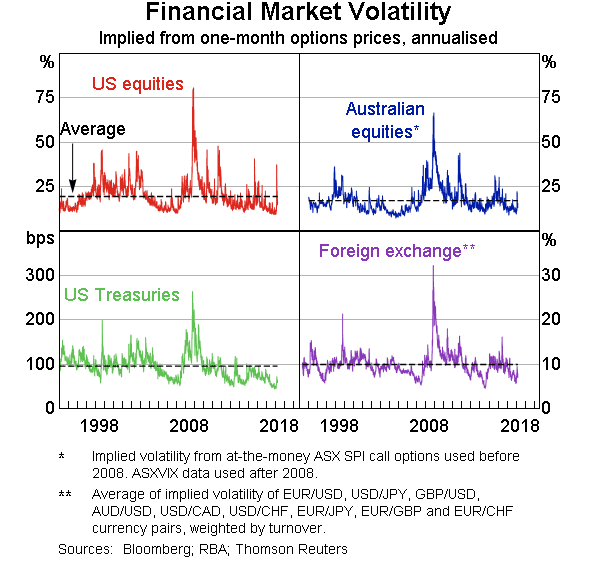
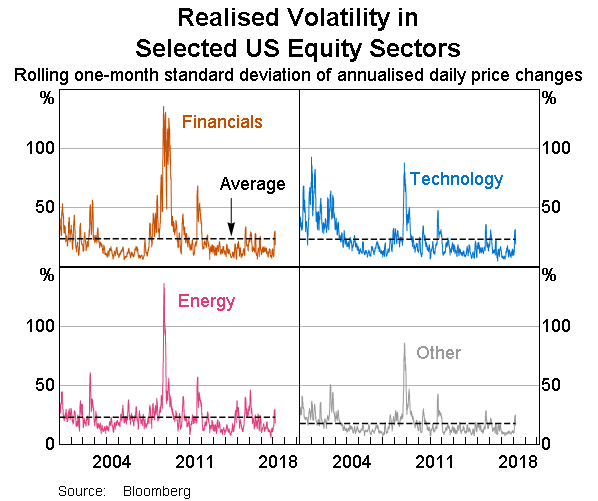
Implied volatility is derived from prices of financial options. Just as the term premium measures compensation for uncertainty about the future path of interest rates, implied volatility reflects uncertainty about the future price of the asset(s) underlying a financial option. The more certain an investor is of the future value of the underlying asset, or the higher their risk tolerance, the lower the volatility implicit in the option's price will be.
Thus, one interpretation of the recent low level of volatility is that market participants have been more confident in their estimates of future outcomes. This is consistent with the observed reduction in the variability of many macroeconomic indicators, such as GDP and inflation, and a decline in the frequency and magnitude of the revisions that analysts have made to their forecasts of such variables (Graph 5). Given the importance of these variables as inputs into the pricing of financial assets, it's no surprise that greater investor certainty about their future values has in turn given investors more certainty about the future value of asset prices.
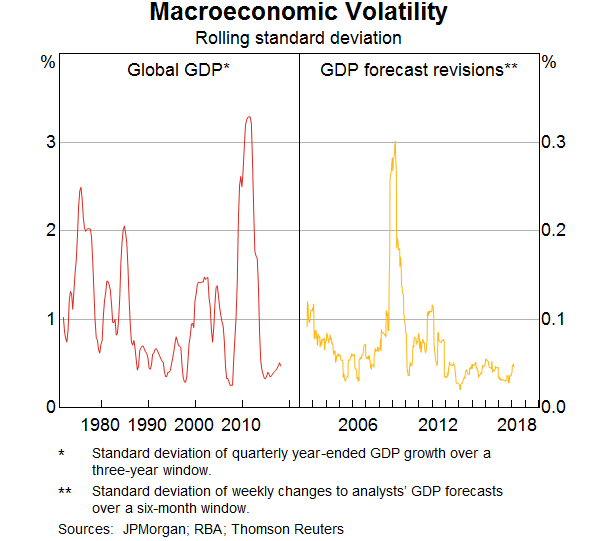
As you can see from all three graphs, a similar degree of certainty about the future was present in the mid 2000s, when there was a high degree of confidence that the ‘Great Moderation’ was going to deliver robust growth and low inflation for a number of years to come.
Monetary policy is also an important input into the pricing of financial assets, so a reduction in the perceived uncertainty around central bank policy settings may also have contributed to low financial market volatility. Monetary policy settings have been relatively stable in recent years, and where central banks have adjusted interest rates or their purchases of assets, these changes have tended to be gradual and clearly signalled in advance. Central banks have also made greater use of forward guidance as a policy tool to attempt to provide more certainty about the path of monetary policy.
But while central banks might act gradually and provide this guidance, the market doesn't have to believe the guidance will come to pass. There are any number of instances in the past where central bank forward guidance didn't come to pass. In my view, it is more important for the market to have a clear understanding about the central bank's reaction function. That is, how the central bank is likely to adjust the stance of policy as the macroeconomic conjuncture evolves. If that is sufficiently clear, then forward guidance does not obviously have any large additional benefit, and runs the risk of just adding noise or sowing confusion.
Hence an explanation for the low volatility could be the assumption of a stable macro environment together with an understanding of central bank reaction function, rather than the effect of forward guidance per se.
The low level of implied volatility could also reflect greater investor willingness to take on financial market risk. This is consistent with measures that suggest demand for derivatives which protect against uncertainty has declined. It is also consistent with other indicators of increased investor appetite for financial risks, such as the narrowing of credit spreads. This increased risk appetite may in part reflect the low yield environment of recent years; protection against uncertainty is not costless, and so detracts from already low returns.
There has also been an increased interest in the selling of volatility-linked derivatives by investors to generate additional returns in the low yield environment in recent years. Effectively, some market participants were selling insurance against volatility. They earned the premium income from those buying the insurance whilever volatility remains lower than expected, but they have to pay out when volatility rises. In recent years, there was a steady stream of premium income to be had. (This is even more so if I were a risk neutral seller of insurance to a risk-averse buyer, in which case, the expected value of the insurance should be positive.) But the payout, when it came, was large. I will come back to this shortly in discussing recent developments.
This reduced demand for volatility insurance combined with increased supply saw the price fall.
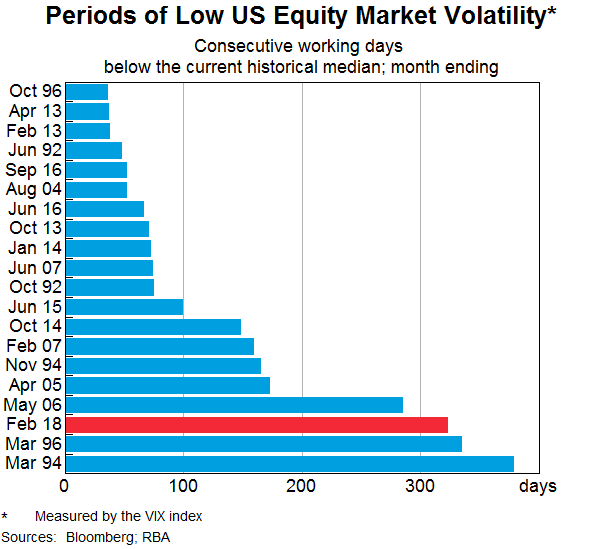
Such an extended period of low volatility is not unprecedented, although the recent episode was among the longest in several decades (Graph 6). Prolonged periods of low volatility have sometimes been followed by sudden increases in volatility – although generally not to especially high levels – and a repricing of financial assets. A rise in volatility could be associated with a reassessment of economic conditions and expected policy settings, in which case, one might not expect the rise to last that long. In contrast, a structural shift higher in volatility requires an increase in uncertainty about future outcomes, rather than simply a reassessment of them. But just as I find it puzzling that term premia in fixed income markets have been so low for so long, I similarly find it puzzling that measures of volatility do not seem to embody much uncertainty either.
The recent spike in volatility in early February is interesting in terms of the market dynamics, coming as it did after a prolonged period of low volatility.[7]
From around September 2017, there had been a rise in bond yields, most notably in the US, as confidence about the outlook for the US and global economy continued to improve. This rise in yields accelerated in January 2018, again most notably in the US, in large part in response to the passage of the fiscal stimulus there. As Graph 7 shows, the rise in Treasury yields in the first part of this year reflected both a rise in real yields and compensation for inflation. This reassessment of the macroeconomic outlook was also reflected in a reassessment (albeit relatively small) of the future path of monetary policy in the US. It is also worth noting that the real yield can incorporate any risk premium on the underlying asset. So the recent rise may also be a result of a change in the assessment of investors about the riskiness of US Treasuries.
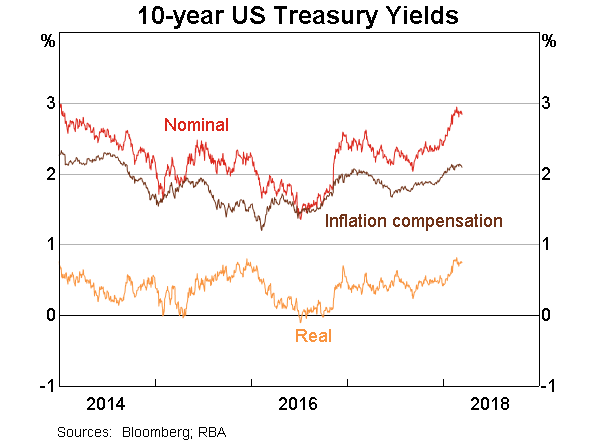
In light of the reassessment of the macro environment it was somewhat surprising that through the month of January, equity prices in the US rose as strongly as they did. As I discussed at the outset of this speech, I would expect that a shift upwards in the structure of interest rates would result in a repricing of asset prices more generally. In late January, this indeed is what happened: equity prices declined, again most sharply in the US. There was a sharp rise in volatility. The initial rise in volatility was exacerbated by the unwinding of a number of products that allowed retail investors (and others) to sell volatility insurance, and the hedging by the institutions that had offered those products to their retail customers. Indeed, unwinding is a euphemism as, in some cases, the retail investor lost all of their capital investment. Having seen the legendary Ed Kuepper and the Aints again last Friday, it's worth remembering to “Know Your Product”, otherwise it will be “No, Your Product”.
What is particularly noteworthy about this episode is how much the rise in volatility, and the large movements in prices, was confined to equity markets. While volatility rose in other asset classes, it did not increase to particularly noteworthy levels. For example, there was relatively little spillover to emerging markets. This is in stark contrast to similar episodes in the past. The fact that these products were particularly associated with volatility in US equity prices appears to have contributed to the limited contagion. Also noteworthy is how short-lived the rise in volatility has been (to date). In discussions with market participants, one possible cause of this is that the unwinding of volatility positions has been largely confined to the retail market, which was relatively small in size. There does not seem to have been much adjustment in the volatility exposures of large institutional market participants to date.
That said, it is conceivable that this episode gives a foretaste of the sort of market dynamics that might occur if there were to be a further rise in yields as the market reassesses the outlook for output and, particularly, inflation.
Demand and Supply Dynamics
Another consideration in thinking about future developments in the yield structure is the balance of demand and supply in the sovereign debt market. It is often difficult to assess the degree of influence that demand and supply dynamics have on the market. But there are some noteworthy developments occurring at the moment that are worth highlighting.
Graph 8 shows the net new debt issuance by the governments of the US, the euro area and Japan, and the net purchases of sovereign debt by their respective central banks. It shows that the peak net purchases by the official sector occurred in 2016. This happens to coincide with the low point in sovereign bond yields, but I would not attribute full causation to that. The central bank purchases are a reaction to the macroeconomic conjuncture at the time which itself has a direct influence on the yield structure. That said, one of the main aims of the central bank asset purchases was to reduce the term premium.
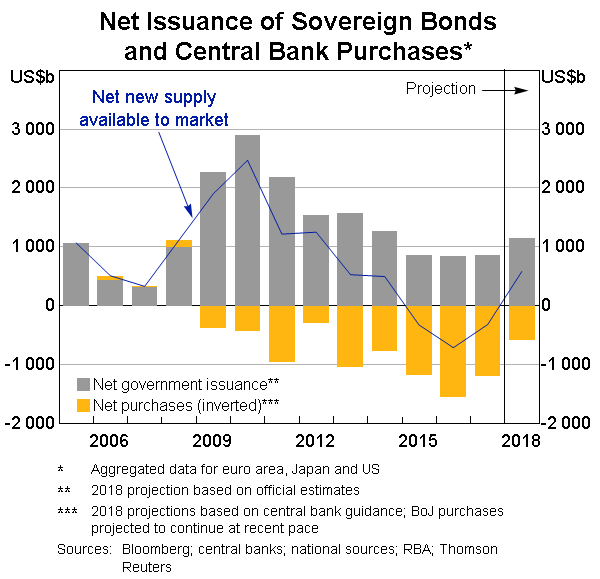
But in 2018, there is going to be a net supply of sovereign debt to the market from the G3 economies for the first time since 2014. This reflects a few different developments. The Federal Reserve started the process of reducing the size of its balance sheet last year by not fully replacing maturing securities with new purchases. While this is a very gradual process, it is a different dynamic from the previous eight years. At the same time, the US Treasury will issue considerably more debt than in recent years to finance the US budget deficit, which has grown from 2 per cent of GDP in 2015 to over 5 per cent in 2019 as the Trump administration implements its sizeable fiscal stimulus.
In Europe, the fiscal position is gradually improving, but the ECB has started the process of scaling back its purchases of sovereign debt, with some expectation these might cease entirely at the end of the year. In Japan, the Bank of Japan is still undertaking very large purchases of Japanese Government debt, which are larger even than the sizeable net issuance to fund Japan's fiscal deficit.
Meanwhile, there is no expectation of significant reserve accumulation by central banks or sovereign asset managers, which can often take the form of sovereign debt purchases. And financial institutions, which have been significant accumulators of sovereign bonds in recent years as they sought to build their liquidity buffers, are not expected to accrue liquid assets to the same extent again in the foreseeable future.
So the net of all of this is that some of the demand/supply dynamics in sovereign bond markets will be different this year from previous years. For a number of years, central banks purchased duration from the market, but that is in the process of reversing. In that regard, an issue worth thinking about is that the central banks don't manage their duration risk in their bond holdings at all. Nor do they rebalance their portfolios in response to price changes, unlike most other investors whose actions to rebalance their portfolios back to their benchmarks act as a stabilising influence.
An additional issue worth thinking about is that, through its purchases of mortgage-backed securities, the US Federal Reserve removed much of the uncertainty associated with the early prepayment of mortgages by homeowners by absorbing the impact of prepayments on the maturity profile of its bond portfolio. Private investors typically hedge this risk, and their hedging activity contributes to volatility in interest rates. As the Fed winds down its balance sheet, it is putting this negative convexity risk back in the hands of private investors, and the associated interest rate volatility will return to the market.
Issuance in a Low Rate Environment
To date I have been discussing developments in the rate structure from the perspective of the investor. But it is also interesting to examine how issuers have responded to the historically low rate structure.
Graph 9 shows that many issuers have responded to the low rate structure, and particularly the absence of any material term premium, by lengthening the maturity of their debt, aka “terming out”. Moreover, lower interest rates on their new issuance have resulted in the average duration of their debt rising by even more.
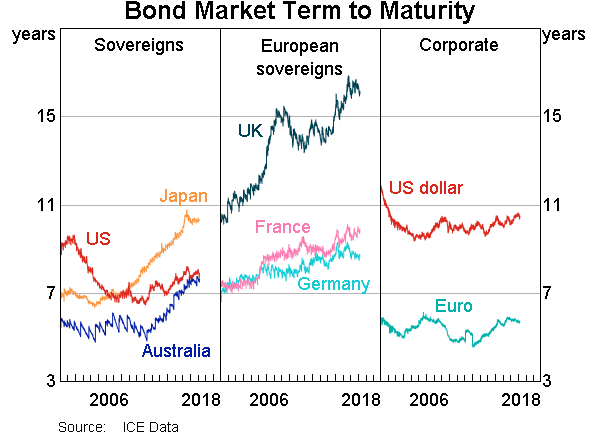
The first two panels show that is true of most sovereigns. The Australian governments, Commonwealth and State, have proceeded along this path. The Australian Office of Financial Management (AOFM) has significantly extended the curve in Australia, by issuing out to a 30-year bond. A number of bonds have been issued well beyond the 10-year maturity, which was the standard end of the yield curve for a number of years. This has also helped state governments to increase the maturity of their issuance.
One interesting exception to the general tendency to term out their debt is the US Treasury, which is undertaking a sizeable amount of issuance at the short end of the curve.
Corporates have also termed out their debt. Some corporates have issued debt with maturities as long as 50 years, which is interesting for at least two reasons. Firstly, a 50-year bond starts to take on more equity-like features. Secondly, many corporates don't even last 50 years.
The Australian banks have also availed themselves of the opportunity to term out their funding for relatively little cost. The recently implemented Net Stable Funding Ratio (NSFR) further incentivises them to do this. As my colleague Christopher Kent noted a couple of days ago, the average maturity of new issuance of the Australian banks has increased from five years in 2013 to six years currently (Graph 10).[8] As with other issuers, this materially reduces rollover risk. The banks have been able to issue in size at tenors such as seven or ten years that they historically often thought to be unattainable at any reasonable price.
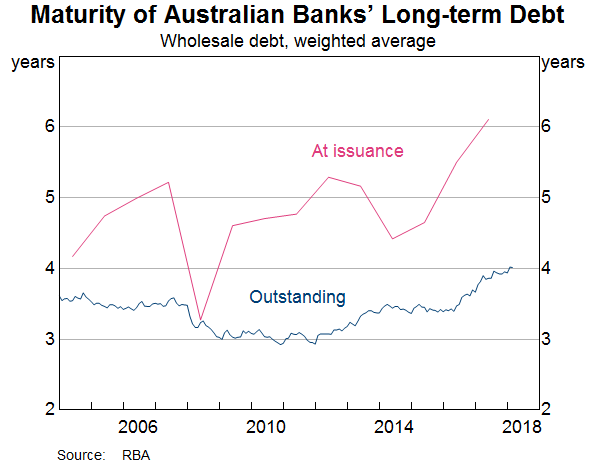
While the low rate structure has often been perceived to be a challenge from the investor point of view, it has been an opportunity for issuers to reduce their rollover risk by extending debt maturities.
Conclusion
The structure of interest rates globally has been at an historically low level for a number of years. This has reflected the aftermath of the financial crisis and the associated monetary policy response. If the global recovery continues to play out as currently anticipated, one would expect that the monetary stimulus will unwind, which would see at least the short-end of yield curves rise.
At the same time, there have been factors behind the low structure of interest rates which are difficult to understand completely and raise questions about its durability. I have discussed some of them here today. In particular, I find it puzzling that there is little compensation for duration in the rate structure. While there are explanations for why interest rates may remain low for a considerable period of time, there is minimal compensation for the uncertainty as to whether or not this will actually occur. At the same time, equity prices embody a view of the future that robust growth can continue without generating a material increase in inflation. Again, there is little priced in for the risk that this may not turn out to be true.
The ongoing improvement in the global economy, together with the fiscal stimulus in the US has caused some investors to question these views. If interest rates continue to rise without a similar rise in expectations about future earnings growth, one would expect to see a repricing of other assets, particularly equity markets. Such a repricing does not necessarily mean a major derailing of the global recovery, indeed it is a consequence of the recovery, but it may have a dampening effect.
At the same time, we need to be alert for the effect the rise in the interest rate structure has on financial market functioning. The recent spike in volatility is one example of this. In my view, that was a small example of what could happen following a larger and more sustained shift upwards in the rate structure. The recent episode was primarily confined to the retail market. The large institutional positions that are predicated on a continuation of the low volatility regime remain in place. That said, I have expected that volatility would move higher structurally in the past and this has turned out to be wrong. But I think there is a higher probability of being proven correct this time.
Endnotes
Thanks to Christian Vallence for his input and to Tomas Cokis, David Halperin and Paul Hutchinson for the volatility analysis. [*]
See Kozlowski J, L Veldkamp, V Venkateswaran (2018), ‘The Tail that Keeps the Riskless Rate Low’, available at <http://www.nber.org/papers/w24362>, NBER Working Paper No. 24362. [1]
One may also want to think about the relatively low level of spreads in a number of fixed income markets, as my colleague Christopher Kent talked about earlier this week. In some markets (but not all), these spreads are close to pre-financial crisis levels. See Kent C (2018), ‘Australian Fixed Income Securities in a Low Rate World’, Address to the Debt Capital Markets Summit, Sydney, 14 March. [2]
Note this scenario is at odds with a secular stagnation view of the world where future earnings growth would not be strong. [3]
Blanchard OJ (1981), ‘Output, the Stock Market and Interest Rates’, American Economic Review, Vol 71, Issue 1, pp 132-143. [4]
Debelle G (2017), ‘Global Influences on Domestic Monetary Policy’, Committee for Economic Development of Australia (CEDA) Mid-Year Economic Update, Adelaide, 21 July. [5]
To be clear, by the current rate structure, I don't mean that the yield curve remains literally unchanged but rather that short-term rates will evolve in line with the forward rates embedded in the current yield curve. [6]
For a discussion of some of the market structure issues, see various posts over recent months under the title of ‘People are Worried that People aren’t Worried Enough' in his Money Stuff blog’, available at <https://www.bloomberg.com/view/topics/money-stuff>, by Matt Levine, as well as “VIX VapoRubOut’, available at <http://streetwiseprofessor.com/?p=10833>,”, blog post by Craig Pirrong aka the Streetwise Professor. [7]
Kent C (2018), ‘Australian Fixed Income Securities in a Low Rate World’, Address to the Debt Capital Markets Summit, Sydney, 14 March. [8]
