Speech Money – Born of Credit?

Christopher Kent[*]
Assistant Governor (Financial Markets)
Remarks at the Reserve Bank's Topical Talks Event for Educators
Sydney –
Most of us would put cold hard cash at the top of our list when we think of money. Others would include funds they have on deposit at a bank. Some might contemplate broader measures of their wealth. Historians would be tempted to tell us about the role of precious metals, coins, salt, shells and even rum when the topic of money is raised. When thinking about the role that money plays in an economy, economics teachers and academics might educate us about money multipliers, the velocity of money and money demand and supply functions. Keen students of episodes of high inflation would discuss Milton Friedman and the notion that inflation is ‘always and everywhere’ a monetary phenomenon. Given this, concerned citizens might be worried about what they see as the ability of private banks to create money via the extension of credit, seemingly at will.
While there are many interesting aspects of money, today I want to focus on the questions of how money is created and how money relates to lending or credit. Along the way, I'll also review what's been happening to both money and credit in Australia over recent decades. The process of money creation is often subject to a degree of confusion, in part because the explanation draws upon a combination of disciplines – accounting, banking and economics.
What Is Money?
It is relatively standard practice to define money according to its ability to do each of the following three things:
- money can be used for transactions – it facilitates the exchange of goods, services or assets thereby avoiding the substantial costs associated with barter
- money is a store of value – it's worth does not fluctuate wildly, nor does it degrade rapidly over time, and
- money acts as a commonly accepted unit of account – it provides a convenient means of comparing the value of a range of different goods, services or assets.
Banknotes and coins – otherwise known as currency – satisfy each of these functions. Currency long ago pushed aside other physical forms of money.
Currently, there is around $75 billion of currency in circulation in Australia (outside of the banking system). However, despite its usefulness, currency represents only a small share of money in modern economies.
Most money consists of deposits in banks, building societies and credit unions (simply referred to here as banks). Just as I can pay for my morning coffee using currency, I can also transfer funds in my bank deposit to the café's account. In either case, the café owner receives a liquid store of value which they are confident will be accepted by others.
Not all bank deposits are equally liquid – for instance, it can take some time to gain access to funds in a term deposit. For this reason, it is common to construct a range of different ‘monetary aggregates’, from the more liquid narrower forms of money – such as M1, which includes currency and current deposits at banks – to ‘broad money’, which also captures less liquid deposits and other financial products that share the characteristics of money discussed earlier (Table 1; Graph 1); for example, broad money includes certificates of deposit or short-term debt securities. For convenience, in what follows I'm going to focus on broad money.
| Measure | Description(a) |
|---|---|
| Currency | Notes and coins held by the private non-bank sector |
| Money base | Currency + banks' holdings of notes and coins + deposits of banks with the Reserve Bank + other Reserve Bank liabilities to the private non-bank sector |
| M1 | Currency + current (cheque) deposits of the private non-bank sector at banks |
| M3 | M1 + all other deposits of the private sector at banks (including certificates of deposit) except deposits of authorised deposit-taking institutions (ADIs) + all deposits of the private non-ADI sector at credit unions and building societies (CUBS) |
| Broad money | M3 + other deposit-like borrowings of all financial intermediaries (AFIs) from the non-AFI private sector (such as short-term debt securities) |
|
(a) These descriptions abstract from some detail. See the Financial Aggregates release for more information. |
|
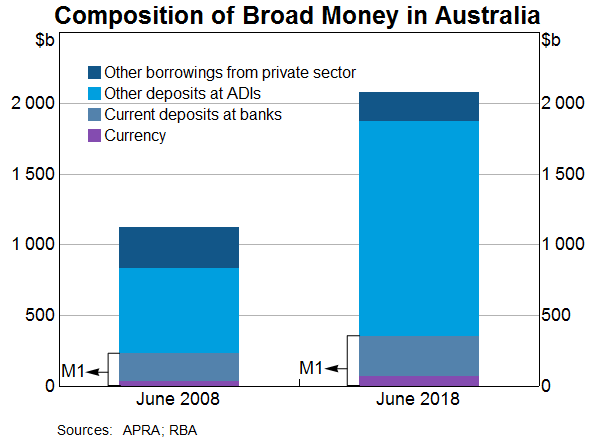
Broad money represents a relatively liquid form of wealth held by Australian households and businesses. It includes currency, deposits and deposit-like products.[1] Unlike ancient forms of physical money – think shells or gold found in the natural environment – these are liabilities issued by authorised deposit-taking institutions (ADIs) and other financial intermediaries.[2] Broad money in Australia is currently around $2 trillion or 115 per cent of the value of annual economic output as measured by nominal GDP; most of that is in the form of banking deposits. Over the past decade, the share of broad money represented by term and other bank deposits has increased in importance at the expense of holdings of current deposits and other borrowings from the private sector.
How Is Money ‘Created’?
Australia's banknotes are produced by the Reserve Bank of Australia and account for most (about 95 per cent) of the value of Australian currency. The rest is accounted for by coins produced by the Royal Australian Mint.
Banks purchase banknotes from the Reserve Bank as required to meet demand from their customers and, in turn, the Reserve Bank ensures that it has sufficient banknotes on hand to meet that demand. Previous research by the Reserve Bank points to a number of drivers of demand for banknotes. The most important is the size of the economy.[3] This is consistent with people holding some fraction of their income in this most liquid form of money in order to undertake transactions.[4] Some share of demand is also accounted for by the desire for a liquid store of wealth. The value of banknotes in circulation as a share of nominal GDP has actually increased over recent years (to around 4 per cent), which suggests that this source of demand has grown strongly. This increase has been observed in a range of countries and is consistent with the low level of interest rates, which has reduced the opportunity cost of holding money (compared with holding interest-bearing deposits).
When customers withdraw currency from an ATM or a bank branch, the value of their deposit holdings declines and the value of their currency holdings increases. The stock of broad money, however, is unchanged.
As I mentioned earlier, the vast bulk of broad money consists of bank deposits. These banking liabilities are created when an Australian household or business has funds credited to their deposit account at an Australian bank. One way this can occur, for example, is when a business deposits currency it has earned with its bank. Again, such transactions add to deposits but do not create money because the bank customer is simply exchanging one type of money (currency) for another (a deposit).
Money can be created, however, when financial intermediaries make loans. Accordingly, the concepts of money and credit are closely linked in a modern economy, albeit not one for one. When a bank extends a loan, it makes money available to the borrower, for example, to buy a car, a house or equipment for a business. The bank may credit the deposit account of the borrower, who withdraws the funds to make their purchase. Alternatively, the bank may directly credit the deposit account of the seller on behalf of the borrower. In either case, the loaned funds will tend to find their way into a deposit somewhere in the banking system. This process adds to the supply of money.
If I stopped here, you might be left with the impression that the process of lending allows the banking system to create endless quantities of money at no cost. However, the process of money creation is constrained in numerous ways and depends on the behaviour of borrowers, banks and regulators, as well as the stance of monetary policy.
In the first instance, the process of money creation requires a willing borrower. That demand will depend, among other things, on prevailing interest rates as well as broader economic conditions. Other things equal, lower interest rates or stronger overall economic conditions will tend to support the demand for credit, and vice versa.
The bank then has to be willing and able to issue the loan:
- It has to satisfy itself that the borrower can service the loan.
- The bank must maintain a sufficient share of its assets in liquid form to meet any drawdowns relating to the new loan, as well as meeting any withdrawals from existing depositors.[5] Otherwise, the bank runs the risk of failing to meet its obligations when they fall due.
- The bank's loans and other assets need to be backed by adequate capital. Capital is needed to absorb unexpected losses arising from defaults or other sources of variation in the value of assets.
- The interest rates charged on loans must cover expected losses on the loan portfolio, as well as the costs of deposits and other sources of funding. Revenues from loans and other assets will also have to cover the operating costs of the bank, while allowing it to earn a profit so that shareholders can earn a reasonable return on the bank's capital.
All of these considerations imply that money creation occurs at some cost, which serves to constrain the extent of lending. These constraints are reinforced by regulatory requirements for liquidity, capital adequacy and lending standards set by the Australian Prudential Regulation Authority. Other things equal, anything that reduces the willingness or ability of banks to make loans can be expected to result in lower growth of (system-wide) money.
It's also worth emphasising that the process of money creation is not the result of the actions of any single bank – rather, the banking system as a whole acts to create money. A single bank may make loans by drawing on its liquid assets, yet not receive the corresponding deposits created in return. Before extending further loans, that bank would need to raise funds in other ways – for example, by issuing debt or equity securities or by waiting for its deposits and liquid assets to rise via other means.[6]
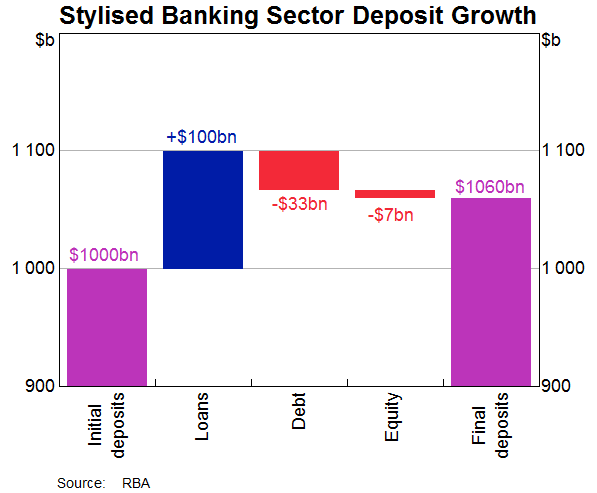
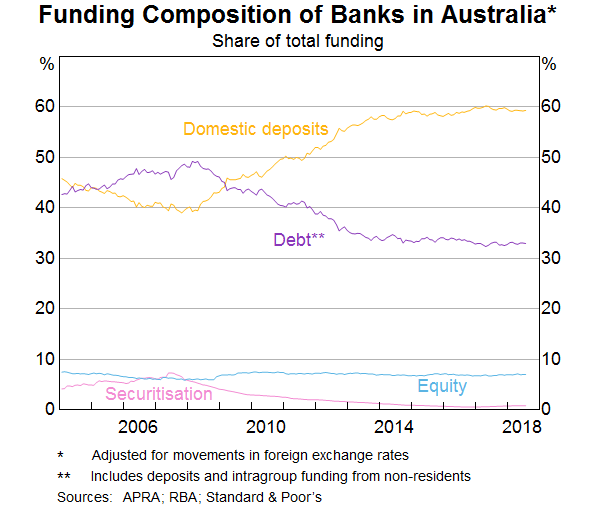
Graph 2 illustrates how the process of money creation can work. It shows an example of an increase in loans of $100 billion. However, the increase in loans in this case leads to an increase in deposits of $60 billion; in other words, the changes are not one for one. This is because there are other sources of funding besides deposits – and indeed, loans are not the only assets held by banks. In the example shown, other funding comes from issuance of debt and equity. The shares from different sources are in line with the actual funding behaviour of the banking system over recent years (Graph 3).
In summary, changes in the stock of broad money are the result of a myriad of decisions, including those of banks, their borrowers, creditors and shareholders. And these decisions take place within the framework of a range of regulatory and institutional arrangements. It is worth noting that the Reserve Bank does not target a particular level or growth rate of money (although it has done so under a previous monetary policy regime).[7] Instead, the Reserve Bank has some influence on the money stock via the effect of its interest rate target for the overnight cash rate on other interest rates in the economy. These in turn affect the cost of borrowing and economic conditions more generally. Ultimately, borrowing and lending decisions – and thus the creation of money – are constrained by the need for prudent banking behaviour, the budget constraints of borrowers and the profitability of lenders.
One final word on the creation of money is that as fun as it is to teach students about traditional money multipliers, I don't find them to be a very helpful way of thinking about the process. In Australia, simple regulatory regimes – which had earlier required banks to hold a minimum share of their deposits as reserves with the Reserve Bank – have been replaced with modern prudential regulation and market discipline. Again, the demand for and supply of credit is the real driver of money. That point can be reinforced by examining the behaviour of credit and money over time.
What Has Money Been Doing and Why?
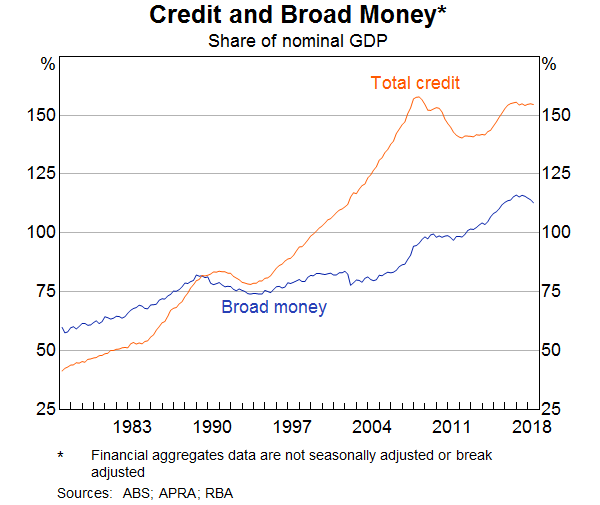
Given that money is used for transactional purposes and as a store of value, it makes sense that most of the time it would at least keep pace with growth in the value of nominal spending. Indeed, in Australia it has grown faster than that over the past 40 years, roughly doubling as a share of nominal GDP (Graph 4).
Growth of credit has been stronger still, roughly tripling as a share of nominal GDP, from under 50 per cent in the early 1980s to over 150 per cent currently. A closer look at the banks' balance sheets shows how these changes have occurred.
In 1980, Australian banks held more than 80 per cent of their liabilities as deposits (worth around $47 billion at the time) (Graph 5). This deposit base was more than sufficient to fund loans of about 60 per cent of assets (worth $34 billion). The majority of the remaining assets were held in the form of securities (mostly government bonds).[8]
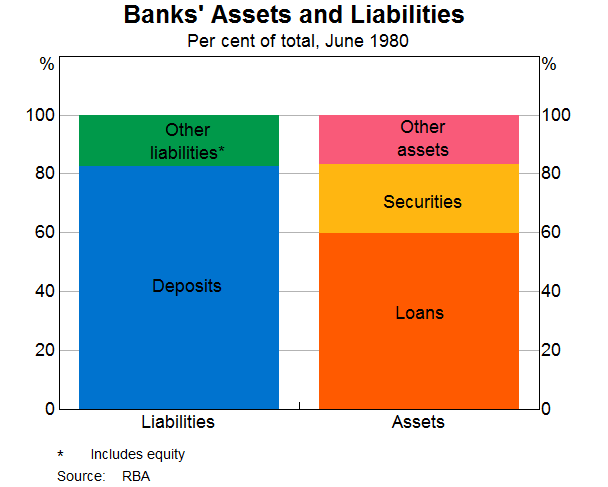
As banks grew through the next four decades or so, there was a marked change in the composition of their balance sheets. These changes reflected choices by both banks and the private sector and were strongly influenced by the deregulation of the financial system. In particular, constraints on banks' business activities were progressively removed in the 1970s and early 1980s (for example, the interest rates they could charge and pay, their product offerings, lending volumes and their asset holdings). This was associated with significant changes in banks' abilities to attract and use different funding sources to support balance sheet growth.[9] By the early 1990s, Australians' demand for credit from banks became larger than the sum of all of their deposits.
Following a period of slower growth around the early 1990s recession, credit growth picked up again and continued to grow much more quickly than money. To enable this, a greater proportion of bank funding during this period was drawn from sources other than deposits. Much of it owed to an increase in the issuance of debt securities, which was supported, in part, by a strong appetite from non-residents for Australian bank debt.
These trends continued until the global financial crisis. Following the crisis, credit growth fell for a while (reflecting a decline in both the supply of and demand for credit). At the same time, the stock of (broad) money increased noticeably, rising by around $1.1 trillion dollars, from around 80 per cent of GDP in 2007 to around 115 per cent in 2018. This strong growth reflected a sharp increase in the share of funding sourced from deposits at the expense of short-term debt securities, consistent with banks seeking more stable funding. Meanwhile, households and businesses increased the share of their assets held in the form of deposits.
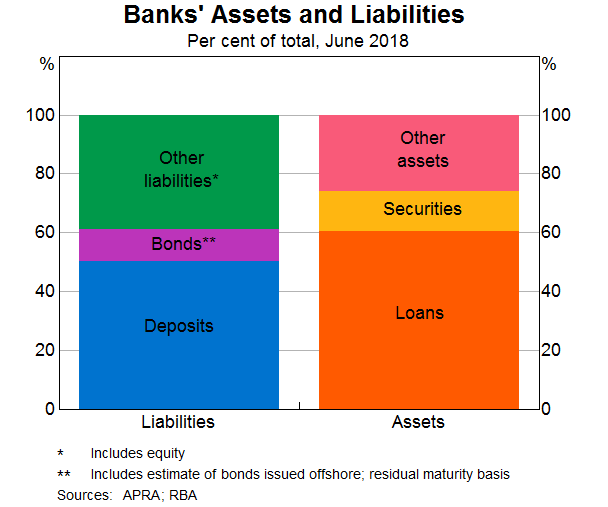
While loans have grown dramatically in nominal terms, to around $2.6 trillion today, the share of loans on banks' balance sheets is the same as it was in 1980 (Graph 6).[10] In contrast, and notwithstanding the increase in deposits since the global financial crisis, the share of deposits has declined over the past 40 years from above 80 per cent to around 50 per cent of banks' balance sheets.[11] Currently, a sizeable share of banks' liabilities is in the form of bonds on issue – a source of funding that was less important in 1980.[12] Banks also have a much larger share of ‘other liabilities’ (such as those to non-residents and related parties, which are not included in domestic monetary aggregates).
Looking back, it is clear that there have been many instances of sustained gaps between the growth of deposits – and broad money more generally – and the growth of credit (Graph 7). While broad money growth outpaced credit growth for most of the period since the financial crisis, this was not the experience of the two decades or more prior to the crisis, when credit typically outpaced broad money.
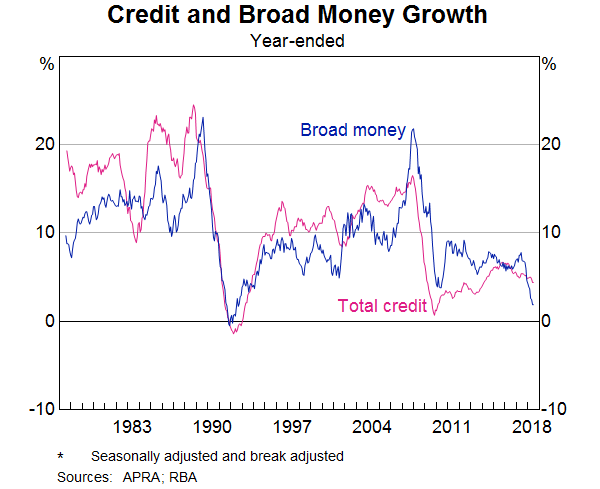
This long history suggests that we should not be concerned about a so called deposit ‘funding gap’. Some commentators have suggested that the recent decline in the growth rate of money has left banks with insufficient deposit funding to support credit growth. According to this hypothesis, banks have been forced to seek other forms of funding, including from short-term money markets, which, so the argument goes, can help to explain the notable rise in rates in those markets in recent months.[13]
What are we to make of this hypothesis? First, such a gap between the growth of deposits and credit has been commonplace over recent decades – and conditions in short-term money markets were benign through much of those earlier episodes. Second, loans are not the only assets on banks' balance sheets; indeed, in recent quarters, growth in these other assets has been particularly slow – slower than both credit and deposits (Graph 8). So deposit growth has more than matched the growth in total assets.
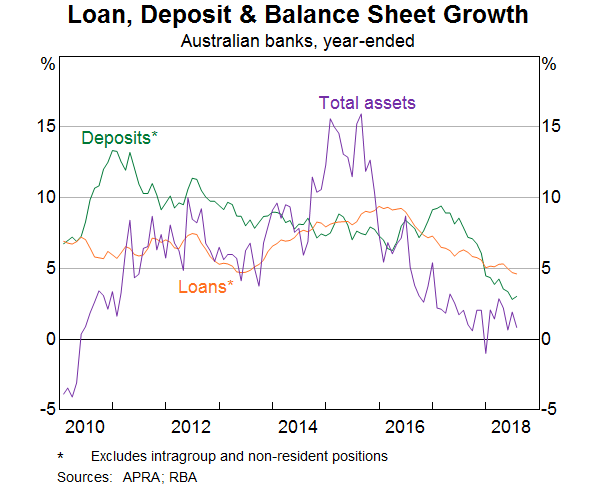
Third, if some banks really did have insufficient deposit funding, we would expect to see them competing more vigorously for deposits by raising interest rates on those products. But retail deposit rates have been flat to down over the past year (Graph 9).
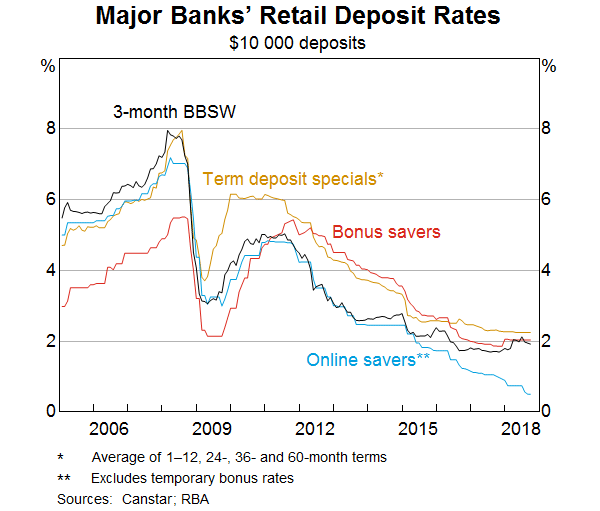
In short, there is little evidence that there is any relationship between the slowing of deposit growth and recent funding pressures in short-term money markets. More generally, given my earlier discussion about the extension of credit leading to the creation of banking system deposits, worrying about slower deposit growth impinging on the banking system's ability to generate credit is putting the cart before the horse.
What Can Money or Credit Tell Us about Broader Economic Developments?
Given this discussion, it is worth asking whether the behaviour of money can tell us anything useful about broader economic developments and, if so, is it more or less useful than the behaviour of credit?
I'm going to address these questions in a very narrow way by examining whether the growth of broad money or credit provides any useful statistical information about the growth of nominal GDP. Because data for money and credit are available about five weeks ahead of the quarterly GDP release, we can examine whether growth in the current quarter of these series provides any additional information about the likely outcome for nominal GDP this quarter. This exercise is intended to merely determine whether money or credit are useful indicators of GDP. It is not intended to demonstrate whether a causal link exists between money or credit and GDP. (Indeed it is possible that the direction of causation runs in either or both, directions.)
I start with a simple model of quarterly nominal GDP growth as a function of recent lags of nominal GDP growth (Model 1 in Table 2). The model is estimated over the inflation-targeting period. This simple model is not particularly useful; lags of nominal GDP growth explain only about 8 per cent of the variation in the current growth of nominal GDP. But it gives us a useful baseline for comparison.
| Model 1 | Model 2 | Model 3 | Model 4 | |
|---|---|---|---|---|
| Constant | 1.14** | 0.85** | 0.88** | 0.70** |
| GDP growth(b) | 0.21 | 0.04 | −0.06 | −0.08 |
| Broad money growth(c) | 0.26* | 0.16 | ||
| Credit growth(c) | 0.31** | 0.25** | ||
| R-squared | 0.08 | 0.15 | 0.17 | 0.22 |
| Adjusted R-squared | 0.04 | 0.07 | 0.09 | 0.10 |
|
(a) Quarterly data; ** indicates statistical significance at the 5 per cent
level; * indicates statistical significance at the 10 per cent
level
|
||||
Adding current and past lags of money growth to the baseline model doesn't improve its performance much; the sum of the coefficients on the money terms are statistically significant, but only at a 10 per cent level (Model 2). Similarly, adding current and past lags of credit growth improves the model's explanatory power only slightly; however, the sum of coefficients on the credit terms are statistically significant at the 5 per cent level (Model 3). Interestingly, if both money and credit terms are included at the same time, only credit growth is statistically significant (Model 4). This suggests that credit growth is a marginally more useful statistical indicator of the growth of economic activity than money growth; again, I should stress that the contribution of the credit variable to the model in terms of its additional explanatory power is very modest.[14]
Conclusion
Currency in circulation has increased as a share of nominal GDP – indeed it's as high as it's been in many decades. But the increase in money, which includes bank deposits, has been even greater over the same period. That increase has been driven by the extension of credit, which depends on the decisions of borrowers and lenders. Banks have been able to fund that additional credit via growth in other sources of funding, including debt securities and equity. The recognition that deposits are created by the banking system via the extension of credit suggests that we should not be concerned about the banking system facing a deposit funding gap. Moreover, it is consistent with simple empirical analysis that suggests that credit is a marginally more useful indicator of the near-term growth in the value of economic activity than money.
References
Battellino R (2007), ‘Australia’s Experience with Financial Deregulation', Address to China Australia Governance Program, Melbourne, 16 July.
Battellino R and N McMillan (1989), ‘Changes in the Behaviour of Banks and Their Implications for Financial Aggregates’, RBA Research Discussion Paper No 8904.
Black S, J Kirkwood, A Rai and T Williams (2012), ‘A History of Australian Corporate Bonds’, RBA Research Discussion Paper No 2012-09.
Bullock M (2018), ‘The Evolution of Household Sector Risks’, Remarks to Ai Group, Albury, 10 September.
Doherty E, B Jackman and E Perry (forthcoming), ‘Money in the Australian Economy’, RBA Bulletin, September.
Flannigan G and A Staib (2017), ‘The Growing Demand for Cash’, RBA Bulletin, September, pp 63–74.
Flannigan G and S Parsons (2018), ‘High-denomination Banknotes in Circulation: A Cross-country Analysis’, RBA Bulletin, March.
Grenville S (1991), ‘The Evolution of Financial Deregulation’, in I Macfarlane (ed), The Deregulation of Financial Intermediaries, Proceedings of a Conference, Reserve Bank of Australia, Sydney, pp 3–35.
Macfarlane I (1998), ‘Australian Monetary Policy in the Last Quarter of the Twentieth Century’, Shann Memorial Lecture, University of Western Australia, Perth, 15 September.
Endnotes
I would like to thank Emma Doherty, Ben Jackman and Emily Perry for their excellent assistance in helping to prepare these remarks. Indeed, I draw heavily on their work: Doherty, Jackman & Perry (forthcoming). [*]
Holdings of these forms of money by the government, residents of other countries and financial intermediaries that issue deposits or similar products are generally excluded from broad money. Considerations such as data availability mean that there are some exceptions to this general rule. [1]
‘Other financial intermediaries’ includes registered financial corporations (RFCs) and cash management trusts. [2]
Growth in nominal GDP will reflect growth in real per capita income, population growth and inflation. Other determinants include interest rates and access to the payment system. See Flannigan and Staib (2017) for more details. [3]
Survey data indicate that the share of payments made with cash continues to fall. See Flannigan and Staib (2017) for a discussion of the different types of demand for currency. Also, Flannigan and Parsons (2018) provide a cross-country perspective on the increase in the number of high-denomination banknotes in circulation. [4]
Doherty et al (forthcoming) contains a highly stylised example that demonstrates how liquidity and capital considerations can affect the decision to extend a loan. [5]
In the same way that extending loans can create deposits, repayment of loans can extinguish deposits. For example, if the funds credited to the seller's bank account above are used to repay an existing loan, the (system-wide) deposit base will remain as it was prior to this series of transactions. Other transactions of financial intermediaries can also create or extinguish deposits and therefore money. For example, when a bank issues a bond or equity, it receives payment, which is typically from the buyer's deposit account, thereby decreasing the stock of money. The reverse occurs when the principal of the bond is repaid, or in the case of the bank buying back its equity. [6]
Macfarlane (1998) provides a summary of the evolution of the RBA's approach to monetary policy in the last quarter of the twentieth century. [7]
Banking regulation from this period required banks to maintain sizeable holdings of certain types of assets. For more information see Battellino and McMillan (1989). [8]
See Grenville (1991), Battellino & McMillan (1989) and Battellino (2007) for further details. [9]
Note that ‘loans’ on bank balance sheets here is distinct from ‘credit’ in the financial aggregates, which is a slightly broader measure. [10]
Graph 3 shows that banks' deposits are around 60 per cent of funding liabilities, which are a subset of total liabilities on banks' balance sheets – excluding those not used for funding. There are also some conceptual differences in the definition of deposits used. [11]
See Black, Kirkwood, Rai and Williams (2012). [12]
See RBA (2018), ‘Domestic Financial Conditions’, Statement on Monetary Policy, August, pp 39–50 for a summary of recent conditions in short-term money markets and a discussion of factors contributing to elevated short-term money market rates. [13]
Two caveats regarding the interpretation of these simple modelling results are in order. First, it is possible that the statistical relationship between credit and GDP growth reflects the effect of some omitted factor — perhaps an indicator of overall financial conditions, such as interest rates for example. Second, this exercise is not intended to capture a potential role for credit in determining the longer-term economic outlook. For instance, the Council of Financial Regulators has identified growing economic risks relating to the high level of indebtedness among Australian households. For a recent discussion of these risks, see Bullock (2018). Taking account of such relationships is beyond the scope of my simple exercise. [14]