Research Discussion Paper – RDP 2022-09 Estimating the Effects of Monetary Policy in Australia Using Sign-restricted Structural Vector Autoregressions
December 2022
1. Introduction
For a central bank to set monetary policy effectively, it is important to understand the macroeconomic effects of changes in its policy rate. However, estimating these effects is difficult. Doing so requires disentangling the effects of changes in the policy rate from the effects of other forces that drive macroeconomic fluctuations and to which monetary policy itself responds. A common way to disentangle these effects is to use a structural vector autoregression (SVAR) with zero restrictions imposed on some of the structural parameters; these zero restrictions correspond to particular assumptions about the structure of the economy. However, these restrictions are sometimes only loosely based on economic theory and may be controversial. Moreover, when applied in the Australian context, such restrictions often yield estimates that imply a so-called ‘price puzzle’, where prices rise in response to a positive monetary policy shock (e.g. Bishop and Tulip 2017).
An alternative approach is to replace the zero restrictions with an arguably weaker set of sign restrictions that are consistent with economic theory or other prior information. For example, rather than assuming that inflation does not respond within the quarter to a change in the policy rate (a zero restriction), we might assume that inflation does not increase in response to an increase in the policy rate (a sign restriction). The cost of using these weaker restrictions is that they only determine a set of possible values for the effects of monetary policy (i.e. they are ‘set identifying’ rather than ‘point identifying’). In this work, I explore the extent to which different sign restrictions are informative about the effects of changes in the cash rate.[1] In doing so, I use a ‘prior robust’ approach to Bayesian inference (Giacomini and Kitagawa 2021). This is important, because there are well-known problems with conducting Bayesian inference in set-identified models; in particular, a component of the prior is never updated and results may be sensitive to the choice of prior (e.g. Poirier 1998; Baumeister and Hamilton 2015).
I initially consider a minimal set of sign restrictions on impulse responses to a monetary policy shock that should, in principle, be sufficient to disentangle this shock from shocks to aggregate demand and supply (Section 3).[2] This involves restricting the cash rate and prices to move in opposite directions following a monetary policy shock, as in Uhlig (2005). When using a standard approach to conducting Bayesian inference under sign restrictions, I find that output falls with reasonably high posterior probability following a positive monetary policy shock. However, the robust approach indicates that the results obtained using the standard Bayesian approach are largely driven by the choice of prior, and the identifying restrictions appear to be uninformative about the responses of macroeconomic variables; for example, the results are consistent with both decreases and increases in output following a positive monetary policy shock. This highlights the importance of using the robust Bayesian approach to inference in this setting.
One explanation for the ambiguous output response obtained using sign restrictions on impulse responses is that combinations of expansionary supply and demand shocks may ‘masquerade’ as positive monetary policy shocks (Wolf 2020). The intuition is that, although the monetary policy shock is the only ‘pure’ shock that satisfies the sign restrictions, linear combinations of other shocks also satisfy the restrictions and have expansionary effects. Consequently, estimates obtained under these sign restrictions may imply that positive monetary policy shocks have expansionary effects even when this is a not a feature of the data-generating process. In an attempt to overcome the problem of masquerading shocks, I consider two types of additional sign restrictions.
First, I impose sign restrictions on the monetary policy reaction function, as in Arias, Caldara and Rubio-Ramírez (2019). More specifically, I impose that – all else equal – the cash rate is not increased in response to lower output and/or prices. These restrictions are consistent with the types of monetary policy rules that are typically used in macroeconomic models. When imposed on their own, these restrictions on the reaction function are more informative about the effects of monetary policy on output than the previous restrictions imposed on impulse responses; under the robust approach to inference, there is reasonably strong evidence that output falls following a positive monetary policy shock. However, there is also evidence of a price puzzle following the shock. Combining the restrictions on the reaction function with restrictions on the impulse responses yields even stronger evidence that output falls following a positive monetary policy shock. Moreover, under the combined restrictions, there is little evidence of a price puzzle at any horizon.
Second, I consider imposing additional sign restrictions based on an existing ‘proxy’ for the monetary policy shock. The proxy is taken from Beckers (2020), who applies a variant of the approach in Romer and Romer (2004) to purge the cash rate of its systematic response to macroeconomic and financial conditions. This proxy has been constructed with the purpose of measuring monetary policy shocks, so it should be positively correlated with the ‘true’ monetary policy shock. Assuming that the proxy is uncorrelated with all other structural shocks (i.e. exogenous), the proxy can be used to point identify the impulse responses to the monetary policy shock in a proxy SVAR (e.g. Gertler and Karadi 2015; Stock and Watson 2018). However, exogeneity of the proxy with respect to other shocks is a strong assumption.
Accordingly, I explore whether the proxy is still informative about the effects of monetary policy when the exogeneity assumption is relaxed and replaced with a set of less-restrictive sign restrictions. Specifically, I impose that the proxy is positively correlated with the monetary policy shock and that the contribution of the monetary policy shock to the variance of the proxy is greater than the contribution of any other shock. These restrictions maintain that the proxy primarily contains information about the monetary policy shock while allowing for the possibility that it is contaminated by other shocks. Augmenting the sign restrictions discussed above with the proxy-based sign restrictions appreciably tightens the set of estimates, which suggests that the proxy contains useful identifying information even without assuming exogeneity. Under the full set of restrictions, there is strong evidence that output and prices fall following a positive monetary policy shock at horizons beyond a year or so.
The results described above are based on the responses of variables to a ‘standard deviation’ monetary policy shock. These are useful for understanding the sign of the response to a change in the cash rate, but are less useful for understanding the magnitude of the response. For instance, understanding the effect of increasing the cash rate by 100 basis points requires knowing the effect of a monetary policy shock that results in the cash rate increasing by 100 basis points; the effects of a standard deviation shock do not provide this information. However, as discussed in Read (2022b), interval estimates obtained under the robust approach to inference may be unbounded (i.e. infinite in length) when the parameter of interest is the impulse response to a 100 basis point shock. This occurs because the identifying restrictions may admit the possibility that the cash rate does not respond on to a monetary policy shock on impact. Sign restrictions may therefore be extremely uninformative about the effects of a 100 basis point shock. Accordingly, I explore the informativeness of the sign restrictions when trying to assess the effects of a 100 basis point shock to the cash rate (Section 4).
Most of the restrictions described above are uninformative about the effects of a 100 basis point shock. However, the full set of restrictions (i.e. including the proxy-based restrictions) allows us to draw some useful inferences about the effects of changes in the cash rate. Following a 100 basis point monetary policy shock, there is fairly strong evidence that output declines by at least half of a per cent after two years, which is consistent with the peak response of output lying towards the upper end of the range of existing estimates. More specifically, I find that there is a reasonably high posterior probability assigned to output responses that exceed the peak responses in the RBA's multi-sector and MARTIN models (Gibbs, Hambur and Nodari 2018; Ballantyne et al 2019). A version of my model that includes the unemployment rate also assigns fairly high posterior probability to unemployment responses larger than the peak response in the MARTIN model.
Overall, this work suggests that some sign restrictions are not very informative about the effects of Australian monetary policy. However, imposing a rich set of restrictions allows us to draw some useful inferences. More generally, a takeaway from this work is that it is important that we continue to search for credible identifying restrictions and question the assumptions underlying existing estimates of the effects of monetary policy.
Before describing the formal framework of the paper (Section 2), I will briefly describe the relationship between this work and the existing literature. Previous work has used sign restrictions in SVAR analyses of the Australian economy, including Liu (2008), Jääskelä and Jennings (2010) and Jääskelä and Smith (2011). These papers impose restrictions on impulse responses to multiple shocks, which requires taking a stand on the nature of the non-monetary policy shocks. In contrast, the restrictions I consider relate (primarily) to the monetary policy shock, and I remain agnostic about the effects of other shocks; this approach is in the same spirit as Uhlig (2005) and Arias et al (2019). Another key difference is that I consider sign restrictions on parameters other than impulse responses. Fisher and Huh (2022) impose sign restrictions on the monetary policy reaction function in an SVAR of the Australian economy, although they do not consider combining these restrictions with other types of identifying restrictions. The aforementioned papers do not address the problem of posterior sensitivity to the choice of prior that arises when using sign restrictions.
More broadly, this paper complements previous attempts to estimate the effects of monetary policy in Australia. Recent examples include Bishop and Tulip (2017) and Beckers (2020), who apply variations of the approach in Romer and Romer (2004) to purge the cash rate of anticipated changes. Earlier work tended to impose a system of zero restrictions sufficient to achieve point identification of impulse responses in an SVAR; examples include Brischetto and Voss (1999), Suzuki (2004), Berkelmans (2005) and Lawson and Rees (2008).
2. Framework
This section describes the SVAR framework, outlines the concepts of identifying restrictions and identified sets, and explains the Bayesian approaches to inference used throughout the paper.
I will make use of the following notation. For a matrix X, vec(X) is the vectorisation of X. When X is symmetric, vech(X) is the half-vectorisation of X, which stacks the elements of X that lie on or below the diagonal into a vector. ei,n is the i th column of the n×n identity matrix, In. 0n×m is an n×m matrix of zeros.
2.1 SVAR, orthogonal reduced form and identified sets
Let yt be an n×1 vector of endogenous variables following the SVAR( p ) process:
where A0 is an invertible n×n matrix with positive diagonal elements (a normalisation on the signs of the structural shocks), with zt a vector of exogenous variables, and contains the coefficients on the variables in xt. Conditional on xt, the structural shocks are normally distributed with zero mean and identity covariance matrix.[3]
In set-identified SVARs, it is convenient to reparameterise the model into its ‘orthogonal reduced form’ (e.g. Arias, Rubio-Ramírez and Waggoner 2018):
where is the matrix of reduced-form coefficients, is the lower-triangular Cholesky factor of the variance-covariance matrix of the reduced-form VAR innovations, with ut = yt – Bxt, and Q is an n×n orthonormal matrix (i.e. QQ′ = In).
I denote the reduced-form parameters by and the space of orthonormal matrices by . In the absence of identifying restrictions, the structural parameters of the SVAR are set identified, because any is consistent with the joint distribution of the data (summarised by ).
The impulse responses to a monetary policy shock are obtained from the coefficients of the vector moving average representation:
where Ch are the reduced-form impulse responses, defined recursively by for with C0=In. The (i, j) th element of the matrix is the horizon-h impulse response of the i th variable to the j th structural shock, denoted by where is the i th row of and is the j th column of Q. Given the normalisation that the structural shocks have unit standard deviation, these impulse responses represent responses to standard deviation shocks.
Sign restrictions on impulse responses or structural coefficients (i.e. elements of A0) can be represented as linear inequality restrictions on a column of Q, where the restrictions are a function of the reduced-form parameters. For example, the sign restriction is a linear inequality restriction on qj. Imposing sign restrictions can be viewed as restricting Q to lie in a subspace of . Let represent a collection of s sign restrictions (including the sign normalisation ).[4] Given the sign restrictions, the identified set for Q is
The identified set for Q contains observationally equivalent parameter values, which are parameter values corresponding to the same value of the likelihood (Rothenberg 1971). Any values of Q within are therefore equally consistent with the joint distribution of the data. The identified set for a particular impulse response is the set of values of as Q varies over its identified set:
2.2 Standard and robust Bayesian inference under sign restrictions
The standard approach to conducting Bayesian inference in set-identified SVARs involves specifying a prior for the reduced-form parameters and a uniform prior for the orthonormal matrix Q (Uhlig 2005; Rubio-Ramírez, Waggoner and Zha 2010; Arias et al 2018).[5] To draw from the resulting posterior in practice, one samples values of from its posterior and Q from a uniform distribution over and discards draws that violate the sign restrictions. Draws of the impulse responses are obtained by transforming the draws of and Q via the function and the posterior is summarised using quantities such as the posterior mean and quantiles.
Because Q is set identified under sign restrictions, the likelihood function is flat over and a component of the prior (specifically, the conditional prior for Q given ) is never updated; in other words, the conditional posterior for Q is equal to the conditional prior (Poirier 1998; Baumeister and Hamilton 2015). This raises the concern that posterior inferences may be sensitive to the choice of conditional prior. Given that the conditional prior under the standard approach to Bayesian inference does not necessarily reflect prior information about the parameters, it is desirable that researchers eliminate or quantify the sensitivity of posterior inference to changes in the conditional prior.
I therefore adopt a ‘robust’ (multiple-prior) Bayesian approach to conduct posterior inference in set-identified models (Giacomini and Kitagawa 2021).[6] In the context of an SVAR, this approach eliminates the posterior sensitivity arising from the choice of the conditional prior. Importantly, this helps to disentangle the information in the posterior that is contributed by the data and the identifying restrictions from the information that is contributed by the conditional prior, and helps to transparently assess the informativeness of the identifying restrictions. The key feature of the approach is that it replaces the conditional prior for Q with the class of all conditional priors that satisfy the identifying restrictions. Combining the class of prior distributions with the posterior distribution for generates a class of posteriors for
Giacomini and Kitagawa (2021) suggest summarising the class of posteriors by reporting the ‘set of posterior means’:
where is the lower bound of the identified set for and is the upper bound. The set of posterior means is an interval containing all posterior means obtainable within the class of posteriors. They also suggest reporting a robust credible region with credibility level , which is an interval estimate for such that the posterior probability assigned to the interval is at least uniformly over the class of posteriors.[7] Given a particular hypothesis of interest (e.g. that the output response to a monetary policy shock is negative at some horizon), the set of posteriors also generates a set of posterior probabilities for this hypothesis. This set can be summarised by the posterior lower and upper probabilities, which are, respectively, the smallest or largest posterior probabilities assigned to the hypothesis over the class of posteriors. Appendix A describes the numerical algorithms used to compute these quantities.
3. Estimates under Different Sets of Sign Restrictions
This section presents estimates of impulse responses to a standard deviation monetary policy shock under different sets of identifying restrictions. Section 3.1 describes the specification of the reduced-form VAR. The subsequent sections describe the different sets of sign restrictions that are imposed and present the estimates obtained under each set of restrictions. I consider different sets of restrictions individually and in combination to disentangle their informativeness. Throughout, I report results based on the standard Bayesian approach to inference with a conditionally uniform prior for Q along with results based on the robust Bayesian approach to inference.
3.1 Specification of reduced-form VAR
The model includes a domestic block and a foreign block. The domestic block includes the interbank overnight cash rate (CASHt), real GDP (GDPt), trimmed mean CPI (CPIt) and the nominal trade-weighted exchange rate index (TWIt) defined such that higher values correspond to an appreciation of the Australian dollar. The foreign block of the model includes the terms of trade (TOTt), US real GDP (USGDPt) and the federal funds rate (FFRt).[8] The choice of variables is broadly consistent with previous SVAR analyses of the Australian economy, including Brischetto and Voss (1999), Dungey and Pagan (2000, 2009), Berkelmans (2005), Lawson and Rees (2008), Liu (2008), Jääskelä and Smith (2011), Jacobs and Rayner (2012) and Manalo, Perera and Rees (2014). All variables enter the model in log levels except for interest rates, which enter in levels. Consistent with Australia's status as a small open economy, the contemporaneous and lagged values of the foreign variables enter as exogenous variables in the equations for yt = (CASHt,GDPt,CPIt,TWIt)′. The model includes four lags of all variables and a constant. In the notation of Equation (1), zt is a vector containing (1,TOTt,USGDPt,FFRt)′ as well as four lags of the foreign variables.
The estimation sample begins in the March quarter 1984 (following the floating of Australia's exchange rate in December 1983) and ends in the December quarter 2019 (before the onset of the COVID-19 pandemic). The start of the sample period is similar to that in other SVAR analyses of the Australian economy, including Berklemans (2005) and Lawson and Rees (2008).
The prior for the reduced-form parameters is the non-informative Jeffreys prior, so The posterior is a normal-inverse-Wishart distribution, from which it is straightforward to obtain independent draws (e.g. Del Negro and Schorfheide 2011). All results are based on 1,000 draws from the posterior of such that the identified set is non-empty.
3.2 Sign restrictions on impulse responses
To begin, I impose the following set of sign restrictions on the impulse responses to a monetary policy shock.
Restriction (1): In response to a positive monetary policy shock at time t, the response of CASHt+h is non-negative and the response of CPIt+h is non-positive for h = 0,1,2,3.
These restrictions impose that the cash rate does not decrease and the CPI does not increase in the year after a positive monetary policy shock. The pattern of restrictions is, in principle, the minimum required to differentiate monetary policy shocks from shocks to supply and demand; conventional theory suggests that a positive monetary policy shock should raise the interest rate and lower prices, while both supply and demand shocks should move the interest rate and prices in the same direction. The restrictions are similar to those considered in Uhlig (2005), who estimates the effects of US monetary policy.[9] Note that the responses of output and the exchange rate are left unrestricted. The horizon over which the impulse responses are restricted is somewhat arbitrary. Uhlig explores different choices of horizon up to a maximum of two years. My choice reflects a belief that monetary policy shocks are likely to have moderately persistent effects. I am hesitant to impose restrictions at horizons much longer than one year, since these restrictions become less credible as the horizon increases, and I want to consider restrictions that are likely to be uncontroversial.[10]
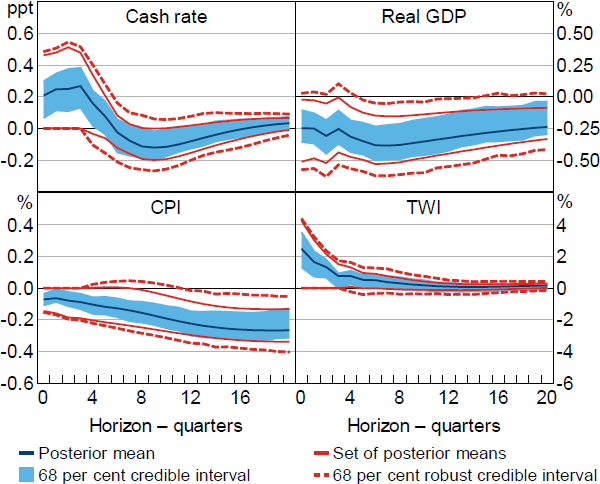
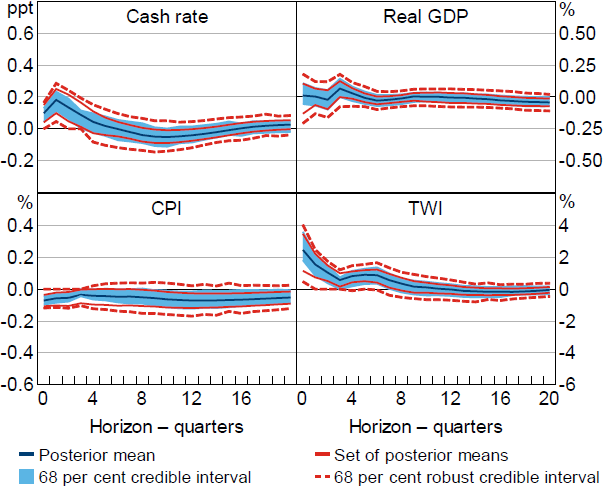
Figure 1 plots impulse responses to a positive, standard deviation monetary policy shock obtained under Restriction (1). When using the standard Bayesian approach to inference, and based on the posterior mean, the shock results in the cash rate increasing by about 20 basis points on impact. Output responds sluggishly and is about 0.2 per cent lower at the two-year horizon. There is a reasonably high posterior probability (around 80 per cent) that the output response is negative at this horizon. Prices also decline persistently and the real exchange rate appreciates on impact before depreciating. Overall, these results are broadly consistent with conventional macroeconomic theory, although they are subject to considerable uncertainty; the 68 per cent credible intervals include zero at most horizons.[11]
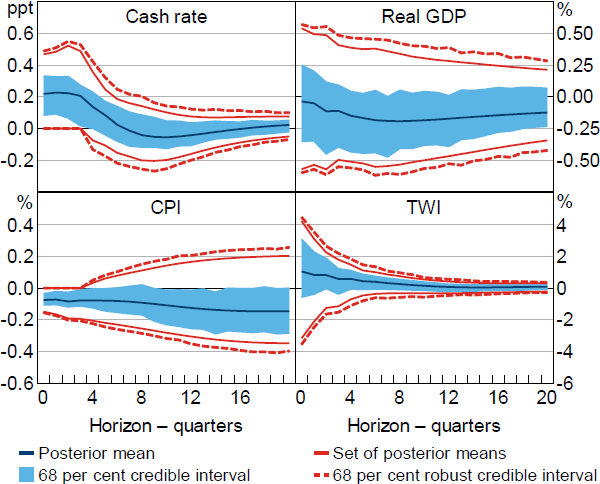
Notes: Restrictions on impulse responses of the cash rate and CPI. Impulse responses are to a positive, standard deviation monetary policy shock.
To what extent are these results sensitive to the choice of conditional prior? To answer this question, I plot the set of posterior means and 68 per cent robust credible intervals obtained using the robust Bayesian approach to inference. Focusing on the output response, the set of posterior means contains zero at all horizons and the posterior lower probability (the smallest posterior probability over the class of posteriors) that the output response is negative after two years is zero. This implies that there are conditional priors that are consistent with the identifying restrictions and that yield posteriors assigning probability one to the hypothesis that output increases two years after the shock. The set of posterior means for the response of prices also includes fairly large positive responses at horizons beyond one year (i.e. beyond the horizons that are restricted to be non-positive), so the data and identifying restrictions cannot rule out the presence of price puzzles. The set of posterior means for the exchange rate response includes large negative responses on impact; this is at odds with ‘exchange rate overshooting’, which is a prediction of conventional open economy models (Dornbusch 1976). Overall, posterior inferences under the standard Bayesian approach appear to be largely driven by the choice of conditional prior. After eliminating this source of posterior sensitivity, the identifying restrictions cannot rule out responses that are at odds with conventional macroeconomic theory, and the identifying restrictions appear to be fairly uninformative about the effects of monetary policy.
Wolf (2020) explains that the apparent expansionary effects of monetary policy shocks obtained under standard sign restrictions on impulse responses may reflect linear combinations of demand and supply shocks ‘masquerading’ as monetary policy shocks. The intuition is that a linear combination of expansionary demand and supply shocks can result in the nominal interest rate increasing and prices decreasing. Because these responses satisfy the sign restrictions used to identify the monetary policy shock, the identified sets for the impulse responses obtained under the sign restrictions are contaminated by linear combinations of impulse responses to these expansionary demand and supply shocks. This suggests that it is necessary to impose additional identifying restrictions to better disentangle the monetary policy shock from other shocks.
To this end, I consider imposing additional restrictions. As noted above, the set of posterior means for the response of the exchange rate obtained under Restriction (1) includes negative responses, which is at odds with conventional macroeconomic theory; standard models imply that the exchange rate should appreciate on impact in response to a positive monetary policy shock before depreciating. This motivates the following set of restrictions, which augments Restriction (1) with a restriction on the response of the exchange rate.
Restriction (2): In response to a positive monetary policy shock at time t, the responses of CASHt+h and TWIt+h are non-negative and the response of CPIt+h is non-positive for h = 0,1,2,3.
As seen in Figure 2, the results under these additional restrictions are little changed from those under Restriction (1) (with the obvious exception of the response of the exchange rate, whose response is restricted). The restrictions on the response of the exchange rate therefore do not appear to mitigate the problem of masquerading shocks.
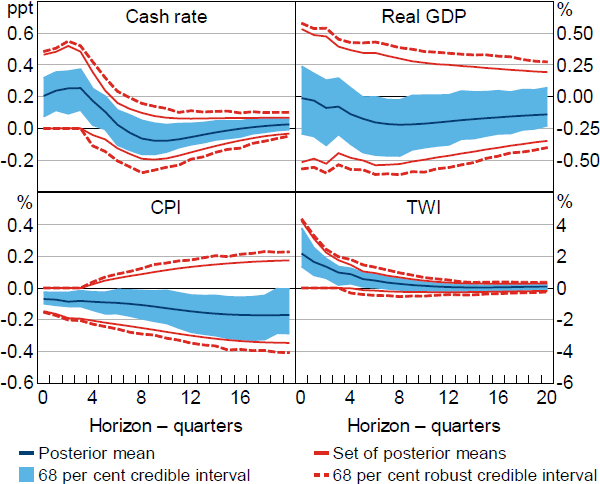
Notes: Restrictions on the impulse responses of the cash rate, CPI and TWI. Impulse responses are to a positive, standard deviation monetary policy shock.
3.3 Sign restrictions on the monetary policy reaction function
As an alternative to imposing further restrictions on impulse responses, I follow Arias et al (2019) and consider restricting the structural coefficients in the equation for the cash rate, which can be interpreted as the monetary policy reaction function. For instance, the coefficients on prices and output are restricted so that monetary policy is not loosened in response to higher output or prices.[12] These restrictions are consistent with monetary policy rules that are typically embedded in macroeconomic models. Moreover, Wolf (2020) explains that these restrictions can help mitigate the masquerading shocks problem. Using a simple New Keynesian model as a data-generating process, he shows that the misidentification of linear combinations of expansionary supply and demand shocks as monetary policy shocks means that the identified structural equation for the nominal interest rate is actually a linear combination of the IS curve, Phillips curve and Taylor rule. When the weight assigned to the true monetary policy shock is small, the implied coefficient on output in the misidentified Taylor rule has the wrong sign. Restricting the sign of this coefficient largely removes the effect of the masquerading supply and demand shocks by ruling out identified shocks that assign small weight to the true monetary policy shock.
To be more concrete, consider the first equation in the SVAR, which I interpret as the monetary policy reaction function:
where is the (1, i) th element of A0. The sign normalisation implies that Consequently, the reactions of the cash rate to output and prices are non-negative if and .
I initially replace the restrictions on impulse responses with restrictions on the coefficients in the reaction function and later combine the two sets of restrictions. This allows me to isolate the informativeness of the restrictions on the reaction function. I maintain the restriction that the cash rate responds positively to the monetary policy shock, so I am always identifying impulse responses to a shock that raises the cash rate on impact.
Restriction (3): The coefficients on GDPt and CPIt in the structural equation for CASHt, a12 and a13, are non-positive, and the impact response of CASHt to the monetary policy shock is non-negative.
Under Restriction (3) and using the standard approach to Bayesian inference, the output response is negative with high posterior probability (Figure 3); the posterior mean indicates that output falls by about 0.3 per cent on impact and remains around this level for two to three years, and the posterior probability of a negative output response after two years is close to 95 per cent. There is reasonably strong evidence that prices – whose response is unrestricted under this set of restrictions – decline with some delay; the posterior probability that the price response is negative is a bit over 80 per cent at the two-year horizon. The credible intervals for the response of the TWI include zero at all horizons. Overall, the results obtained under the conditionally uniform prior suggest that the restrictions are quite informative about the effects of monetary policy on output and prices. However, as in the case where the sign restrictions were imposed on the impulse responses, the results are sensitive to the choice of conditional prior; the set of posterior means includes zero for all variables and horizons.
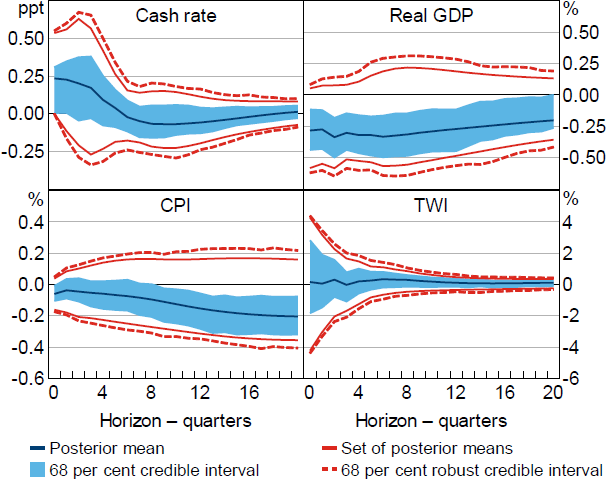
Notes: Restrictions on coefficients in the monetary policy reaction function (real GDP and CPI). Impulse responses are to a positive, standard deviation monetary policy shock.
The coefficient on the exchange rate was left unrestricted under Restriction (3). However, it seems plausible that the central bank may take into account the exchange rate when setting policy, including indirectly via its effects on forecasts of other macroeconomic variables.[13] For example, an appreciation of the exchange rate will put downward pressure on consumer prices due to the direct effect of lower import prices. It will also lead to a decline in exports, which will weigh on output. To the extent that these developments occur with a lag and the central bank sets policy in a forward-looking manner, it may therefore want to cut the policy rate in response to the appreciation. This motivates restricting the coefficient on the exchange rate. The set of posterior means for the coefficient on the exchange rate under Restriction (3) is [–0.25,0.24], so restricting this coefficient to be non-negative will truncate (at least at some values of ) and thus may result in more informative inference about the impulse responses.[14] I therefore consider the following set of restrictions, which extends the restrictions on the systematic component of monetary policy introduced in Arias et al (2019) to the open economy setting.[15]
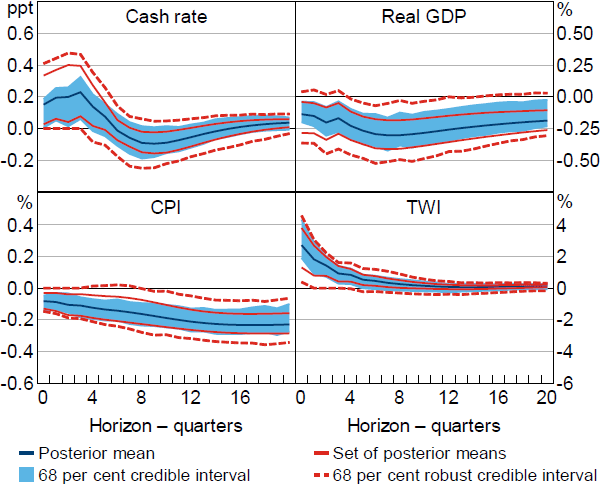
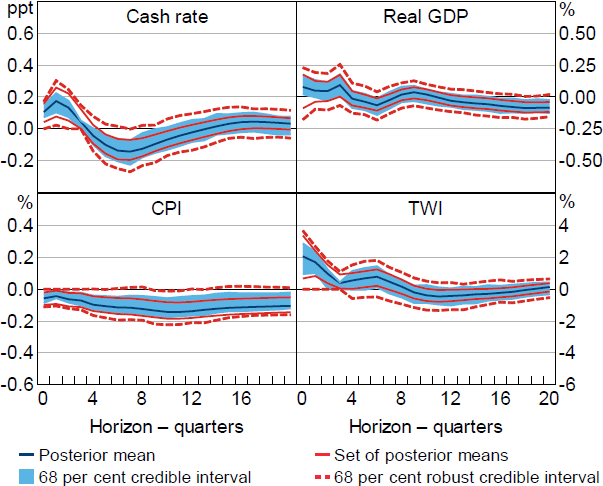
Restriction (4): The coefficients on GDPt and CPIt in the structural equation for CASHt, a12 and a13, are non-positive, the coefficient on TWIt, a14, is non-negative, and the impact response of CASHt to the monetary policy shock is non-negative.
Relative to Restriction (3), the additional restriction on the exchange rate coefficient leads to more informative inference about the output response; the set of posterior means for the output response excludes zero at horizons beyond one year and the output response is negative at the two-year horizon with a posterior lower probability of around 75 per cent (Figure 4). The estimates do not rule out increases in prices at short-to-medium horizons, although prices fall with high posterior lower probability at longer horizons. The restriction reduces the prominence of negative exchange rate responses, although the posterior lower probability that the exchange rate appreciates on impact is still only around 25 per cent.
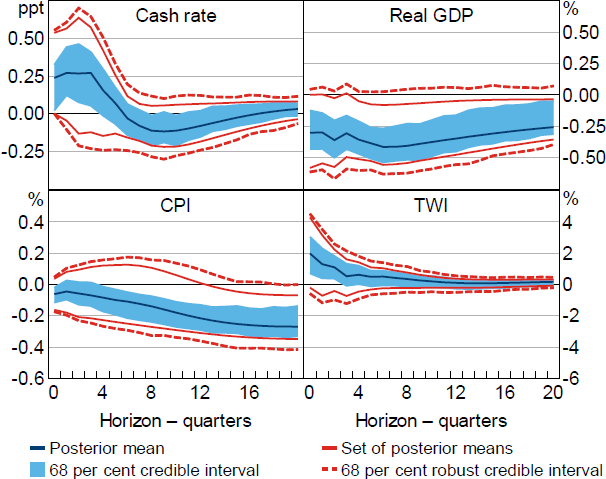
Notes: Restrictions on coefficients in the monetary policy reaction function (real GDP, CPI and TWI). Impulse responses are to a positive, standard deviation monetary policy shock.
Overall, comparing the results in Figures 2 and 4, it appears that restrictions on the monetary policy reaction function are more informative about the responses of output and prices to a monetary policy shock than restrictions on the impulse responses. However, the restrictions do not rule out positive price responses at short-to-medium horizons or an exchange rate depreciation on impact. Both of these results are at odds with conventional macroeconomic theory.
3.4 Combining sign restrictions on impulse responses and reaction function
Given the inability of restrictions on the monetary policy reaction function to rule out price puzzles and exchange rate depreciations, I consider combining these restrictions with restrictions on the impulse responses. For this exercise, I include the restrictions relating to the exchange rate.
Restriction (5): In response to a positive monetary policy shock at time t, the responses of CASHt+h and TWIt+h are non-negative and the response of CPIt+h is non-positive for h = 0,1,2,3. Additionally, the coefficients on GDPt and CPIt in the structural equation for CASHt, a12 and a13, are non-positive and the coefficient on TWIt, a14, is non-negative.
Under Restriction (5), output falls with high posterior lower probability at horizons between one and three years (Figure 5). For example, the posterior lower probability of a negative output response at the two-year horizon is about 95 per cent. Combining the restrictions reduces the prominence of price puzzles at short-to-medium horizons, although a positive price response is not ruled out entirely; for instance, the posterior upper probability of a positive price response at the two-year horizon is about 40 per cent. Prices fall with high posterior lower probability at longer horizons; the posterior lower probability of a negative price response is at least 90 per cent at horizons greater than three years. Overall, the restrictions appear to be reasonably informative about the effects of monetary policy when combined, in the sense that output, prices and the TWI all respond to monetary policy in a way that is consistent with macroeconomic theory with high posterior probability regardless of the choice of conditional prior, at least at longer horizons.
Notes: Restrictions on impulse responses (cash rate, CPI and TWI) and coefficients in the monetary policy reaction function (real GDP, CPI and TWI). Impulse responses are to a positive, standard deviation monetary policy shock.
3.5 Restrictions on relationship with a proxy variable
Although Restriction (5) appears to be fairly informative about the macroeconomic effects of monetary policy shocks, additional credible restrictions could be valuable in reducing uncertainty. One possible approach is to impose restrictions on the impulse responses to other shocks or on the coefficients in other structural equations. However, this requires making assumptions about the nature of these other shocks or equations; for example, based on predictions from a macroeconomic model (e.g. Jääskelä and Jennings 2010). Instead, I consider alternative restrictions that are not tied to a particular macroeconomic model.
Specifically, I impose restrictions on the relationship between the monetary policy shock and an existing proxy for that shock. The proxy is taken from Beckers (2020), who applies a variant of the approach in Romer and Romer (2004) to purge the cash rate of its endogenous response to economic conditions. He additionally controls for the systematic response of the cash rate to credit conditions (measured by money market spreads) and uses cash rate expectations (proxied for by estimated zero-coupon forward rates) to further purge the cash rate of variation that is anticipated by financial market participants. I use this ‘unanticipated’ change in the cash rate as a proxy for the monetary policy shock.
The proxy in Beckers (2020) was constructed with the purpose of measuring monetary policy shocks, so it is natural to assume that the proxy is positively correlated with the monetary policy shock. Additionally assuming that the proxy is contemporaneously uncorrelated with all other structural shocks (i.e. exogenous) implies that the proxy can be used to point identify the monetary policy shock in a proxy SVAR (e.g. Stock and Watson 2018).[16] However, even though this measure is purged of many potentially endogenous drivers of the cash rate, the exogeneity condition is still quite strong and will be violated if the variables used to purge the cash rate of its endogenous response to economic and financial conditions do not control for the RBA's response to all other shocks hitting the economy.
To relax this assumption, I instead impose restrictions that the proxy and the true monetary policy shock are positively correlated, and that variation in the proxy primarily reflects the monetary policy shock.[17] This allows me to incorporate the information included in the proxy while allowing the proxy to be contaminated by other shocks. Because I do not impose exogeneity with respect to nonmonetary policy shocks, the impulse responses remain set identified and I can continue to impose the other sign restrictions considered above.
More formally, assume that the proxy, mt, contains information about the structural shocks according to the process
where independently of . Substituting out using the SVAR representation yields the ‘first-stage regression’ of the proxy on the contemporaneous and lagged values of the variables entering the VAR:
where and are reduced-form parameters that are identified from the regression of mt on yt and xt. The covariance between the proxy and the structural shocks is
Restrictions on elements of can therefore be expressed as restrictions on Q, where the restrictions are a function of the reduced-form parameters in the VAR for yt and the first-stage regression. The restriction that mt is positively correlated with the monetary policy shock, , is equivalent to , which is a linear inequality restriction on the first column of Q .[18] The contribution of the i th structural shock to the variance of mt is
If the contribution of the monetary policy shock to the variance of the proxy is greater than that of any other shock, then This is equivalent to the restriction that the correlation between mt and the monetary policy shock is greater in absolute value than the correlation between mt and any other structural shock, Given that the correlation between the proxy and the monetary policy shock is positive, this is equivalent to
which can be expressed as a system of linear inequalities in vec(Q).
The vector of reduced-form parameters is now augmented with the parameters from the reduced-form process for the proxies, so . Following Giacomini et al (2022b), I assume a (non-informative) Jeffreys prior for the reduced-form parameters in the first-stage regression that is independent of the prior over the reduced-form VAR parameters. The proxy from Beckers (2020) is available from the March quarter 1994 to the December quarter 2018. I continue to estimate the VAR over the same (longer) sample used above, and use the sample over which the proxy is available to estimate the first-stage regression.
I augment the restrictions on impulse responses and the monetary policy reaction function with the proxy-based restrictions.
Restriction (6): In addition to the restrictions in Restriction (5), mt is positively correlated with the monetary policy shock and the contribution of the monetary policy shock to the variance of the proxy is greater than the contribution of any other structural shock.
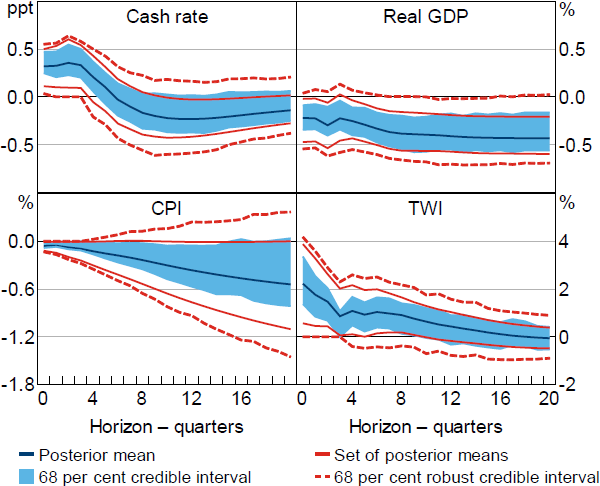
The set of posterior means for the correlation between the proxy and the monetary policy shock, , is [0.14, 0.22] and the 95 per cent robust credible interval is [0.05, 0.40]. This suggests that the proxy and monetary policy shock are fairly weakly correlated. Nevertheless, the additional restrictions appear to sharpen identification relative to Restriction (5); for example, as seen in Figure 6, the set of posterior means for the output response at the two-year horizon obtained under Restriction (6) is about 60 per cent as wide as the set obtained under Restriction (5). A natural question is whether the apparent informativeness of the proxy is because the VAR does not span the relevant information set. For instance, credit spreads are used to construct the proxy but are not included in the VAR. Section 5.3 presents estimates from a model that includes credit spreads.[19]
Notes: Restrictions on impulse responses (cash rate, CPI and TWI), coefficients in the monetary policy reaction function (real GDP, CPI and TWI), and relationship between monetary policy shock and proxy for the shock. Impulse responses are to a positive, standard deviation monetary policy shock.
The set of posterior means for the output response obtained under Restriction (6) excludes zero at all horizons, and the robust credible intervals exclude zero at horizons between one and four years. The additional restrictions also appear to largely rule out the price puzzle; the posterior lower probability that prices fall following the shock is greater than 80 per cent at all horizons and greater than 90 per cent at horizons longer than three years. Overall, the proxy variable appears to contain useful identifying information even when discarding the usual fairly strong exogeneity assumption and despite the proxy appearing to be only weakly correlated with the monetary policy shock.
3.6 Plausibility and informativeness of restrictions
This section quantitatively assesses the ‘plausibility’ of the restrictions, which is the degree to which the identifying restrictions are compatible with the observed data. It also systematically compares the informativeness of the different restrictions. The approaches to quantifying these concepts follow Giacomini and Kitagawa (2021).
3.6.1 Posterior plausibility
When there are a sufficient number of sign restrictions, the identified set may be empty at particular values of . The posterior probability that the identified set is non-empty – the ‘posterior plausibility’ – can be used to quantify the degree to which the identifying restrictions are consistent with the observed data (as summarised by the reduced-form parameters). If the posterior plausibility is zero (which will occur if every draw of yields an empty identified set), the identifying restrictions are inconsistent with the observed data. Conversely, if the identifying restrictions are correct, the posterior plausibility should approach one asymptotically as the sample size grows and the reduced-form posterior converges towards the true value of .
Under Restrictions (1)–(4), the posterior plausibility of the restrictions is one (i.e. the identified set is never empty), and it is greater than 99 per cent under Restriction (5). These restrictions therefore appear to be ‘plausible’ in the sense that they are consistent with the observed data. In contrast, the posterior plausibility of Restriction (6) is only around 45 per cent. However, as discussed in Giacomini, Kitagawa and Read (2022a), this does not necessarily mean that the restrictions are likely to be incorrect. In a finite sample, the posterior may assign probability to regions of the reduced-form parameter space that are ‘far’ from the true value, in which case the posterior plausibility may be low even when the identifying restrictions are correct.
3.6.2 Informativeness of restrictions
The informativeness of a given set of identifying restrictions can be quantified by comparing the width of the set of posterior means against that obtained under a less-restrictive model. Specifically, I compare the width of the set of posterior means of the output response at the two-year horizon under each set of restrictions against that obtained when the only restriction is that the impact response of the cash rate is non-negative (Table 1).[20] If the restrictions were point identifying, the informativeness measure would be 100 per cent.
| Restriction | |||||
|---|---|---|---|---|---|
| (1) | (2) | (3) | (4) | (5) | (6) |
| 13.1 | 17.7 | 25.9 | 54.5 | 64.3 | 78.2 |
| Note: Informativeness is measured as the percentage by which the set of posterior means for the output response at the two-year horizon narrows relative to a model where only the impact response of the cash rate is restricted; higher numbers indicate more-informative restrictions. | |||||
Based on this measure, the restrictions on the monetary policy reaction function are substantially more informative than the restrictions on the impulse responses; for instance, relative to the ‘unrestricted’ model, Restriction (1) shrinks the set of posterior means by 13 per cent, whereas Restriction (3) shrinks the set of posterior means by 26 per cent. Restriction (4), which adds a restriction on the systematic response to the exchange rate, shrinks the set of posterior means by over 50 per cent. The full set of restrictions (Restriction (6)) shrinks the set of posterior means by close to 80 per cent.
In principle, differences in the apparent informativeness of the identifying restrictions can arise from two sources: 1) differences in the extent to which the restrictions truncate the identified set on average over the reduced-form posterior; and 2) differences in the space of reduced-form parameters that have a non-empty identified set. Because the posterior plausibility is close to one for Restrictions (1)–(5), differences in the informativeness measure across these restrictions arise from the restrictions truncating the identified set to a greater or lesser degree. In contrast, because the posterior plausibility of Restriction (6) is around 45 per cent, the results under this set of restrictions are based on a different posterior distribution of reduced-form parameters. This makes it more complicated to directly compare the informativeness of Restriction (6) to the other sets of restrictions. To make a like-for-like comparison, I take the draws of the reduced-form parameters obtained under Restriction (6) and impose Restriction (5). Doing this returns results that are very similar to those obtained under Restriction (5), which suggests that it is the ability of Restriction (6) to truncate the identified set, rather than the different reduced-form posterior, which is driving the measured informativeness.[21]
4. The Effects of a 100 Basis Point Monetary Policy Shock
The impulse responses presented in Section 3 represent responses to a standard deviation monetary policy shock. However, if we are interested in understanding the effects of, say, increasing the cash rate by 100 basis points, it is necessary to know the effects of a monetary policy shock that raises the cash rate by 100 basis points. Accordingly, I explore the informativeness of the sign restrictions with respect to the impulse responses to a 100 basis point monetary policy shock.
The horizon-h impulse response of variable i to a 100 basis point monetary policy shock is
As discussed in Read (2022b), the identified set for may be unbounded (i.e. infinite in length) when the identified set for the impact response of the cash rate includes zero; intuitively, if , it may be possible to make arbitrarily large by considering a sequence of values for Q converging to the point where Consequently, the set of posterior means and robust credible intervals may also be unbounded. This suggests that sign restrictions may be very uninformative about the impulse responses to a 100 basis point monetary policy shock. Note that I am not claiming that it is reasonable for the cash rate to not respond within the quarter to a monetary policy shock; however, sign restrictions do not necessarily preclude this possibility.
Read (2022b) advocates reporting the posterior probability that , defined as , since this tells us which summaries of the class of posteriors (e.g. robust credible intervals) are guaranteed to be bounded. Table 2 tabulates this probability under the different sets of restrictions. Under Restrictions (1)–(4), ranges between 89 and 100 per cent. This means that the identifying restrictions admit the possibility that the cash rate does not respond on impact to a monetary policy shock with high posterior probability. As a consequence, the set of posterior means, the set of posterior medians and robust credible intervals (at conventional credibility levels) may be unbounded when the parameter of interest is the impulse response to a 100 basis point shock. In fact, is 100 per cent under Restriction (3), so the identified set for may be unbounded at all values of . Restrictions (5) and (6) yield lower values of , but these are still greater than 50 per cent. Together, these results suggest that the sign restrictions may be quite uninformative about the effects of a 100 basis point change in the cash rate.[22]
| Restriction | |||||
|---|---|---|---|---|---|
| (1) | (2) | (3) | (4) | (5) | (6) |
| 91.8 | 89.1 | 100.0 | 98.8 | 73.1 | 54.9 |
| Note: See Appendix A for details about how these posterior probabilities are approximated. | |||||
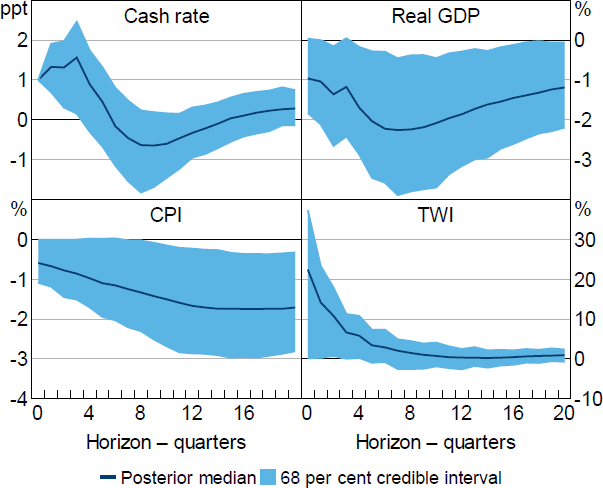
Figure 7 plots the posterior median and 68 per cent credible intervals for the impulse responses to a 100 basis point shock obtained under Restriction (6) and a conditionally uniform prior. Based on the posterior median, output is about 2 per cent lower 2 to 3 years after the shock, consumer prices are about 2 per cent lower four years after the shock and the exchange rate appreciates by about 20 per cent on impact. These estimates suggest that monetary policy has potent effects on macroeconomic variables, although the credible intervals convey that there is substantial uncertainty around these estimates. However, even these wide credible intervals substantially overstate the informativeness of the identifying restrictions; for example, a numerical approximation of the set of posterior medians for the output response (not plotted) is extremely wide, with an average width of over 100 percentage points for the horizons considered. This implies that the results obtained under the standard Bayesian approach to inference are largely driven by the conditional prior.
Despite the identifying restrictions appearing to be fairly uninformative about the effects of a 100 basis point shock, we can still draw useful inferences about these effects using the posterior lower and upper probabilities, which are respectively the smallest and largest posterior probabilities that can be assigned to a particular hypothesis given the class of posteriors. Table 3 tabulates the posterior lower probability that the responses of output and prices exceed different thresholds at selected horizons under Restriction (6); that is, the posterior lower probability assigned to the hypothesis given different values of x. The posterior upper probabilities are close to 100 per cent, so I omit them.[23]
Note: Estimates obtained under Restriction (6), which includes restrictions on impulse responses (cash rate, CPI and TWI), coefficients in the monetary policy reaction function (real GDP, CPI and TWI), and relationship between monetary policy shock and proxy for the shock.
| Horizon | Threshold (%) | ||||||||||
|---|---|---|---|---|---|---|---|---|---|---|---|
| Output | Prices | ||||||||||
| 0.0 | –0.25 | –0.5 | –1.0 | –2.0 | 0.0 | –0.25 | –0.5 | –1.0 | –2.0 | ||
| Impact | 75.6 | 38.6 | 14.5 | 3.1 | 1.0 | 100.0 | 22.7 | 11.1 | 2.4 | 0.2 | |
| One year | 86.8 | 81.7 | 61.5 | 22.0 | 3.6 | 80.8 | 30.6 | 15.9 | 5.3 | 0.8 | |
| Two years | 96.3 | 93.7 | 82.1 | 41.0 | 8.7 | 86.0 | 45.8 | 25.3 | 8.7 | 1.3 | |
| Three years | 94.2 | 88.7 | 71.5 | 31.4 | 7.4 | 96.2 | 75.5 | 43.2 | 14.4 | 3.3 | |
| Four years | 91.8 | 82.8 | 57.5 | 23.1 | 5.3 | 99.0 | 87.9 | 57.3 | 19.7 | 4.0 | |
| Note: Posterior lower probability is the smallest posterior probability assigned to the hypothesis (e.g. that output declines by more than 1 per cent at the one-year horizon) within the class of posteriors consistent with Restriction (6). | |||||||||||
Focusing first on the response of output, the posterior lower probability that output declines by more than 0.25 per cent after two years is over 90 per cent and the posterior lower probability that it declines by more than 0.5 per cent is over 80 per cent. There is therefore fairly strong evidence for an appreciable decline in output in response to a 100 basis point shock, in the sense that a decline exceeding 0.5 per cent at the two-year horizon is assigned reasonably high posterior probability under any choice of conditional prior.
Point estimates from previous SVAR analyses of the Australian economy based on zero restrictions suggest that the maximum decline in real GDP following a 100 basis point shock is between 0.2 per cent and 1 per cent (see Figure 3 in Lawson and Rees (2008)). The point estimates from Beckers (2020) also suggest that the peak decline of real GDP is about 1 per cent, although there is substantial uncertainty around this estimate. Based on the RBA's multi-sector dynamic stochastic general equilibrium model, output is estimated to decline by a maximum of about 0.4 per cent (Gibbs et al 2018). The peak response of output in the RBA's macroeconometric model, MARTIN, is also about 0.4 per cent.[24] The results in Table 3 are consistent with the peak response of output lying towards the upper end of this range of estimates, in the sense that – regardless of the choice of conditional prior – fairly large posterior probability is assigned to output responses exceeding the estimates at the lower end of this range. In particular, there is reasonably high posterior lower probability (around 90 per cent) assigned to the hypothesis that the output response after two years exceeds the peak responses in the multi-sector and MARTIN models.
Turning to the response of prices, the posterior lower probability that prices fall by more than 0.25 per cent after three years is around 75 per cent, so there is reasonably robust evidence for an appreciable fall in prices following a 100 basis point shock. The evidence for effects exceeding 1 per cent is less robust; for example, the posterior lower probability that prices decline by more than 1 per cent after three years is only around 15 per cent. For comparison, the point estimates in Beckers (2020) indicate that prices fall by around 0.7 per cent after two or so years, although this estimate is again associated with substantial uncertainty.
5. Robustness Exercises
This section explores the sensitivity of the results obtained under Restriction (6) to selected changes in the modelling assumptions.
5.1 Model in first differences
Typical monetary policy rules embedded in macroeconomic models assume that the central bank responds to inflation and some measure of economic activity, such as the output gap or real GDP growth. In contrast, the monetary policy reaction function underlying the restrictions imposed in Section 3 is specified in the levels of prices and output. As a robustness exercise, I re-estimate the reduced-form VAR with all variables in first differences with the exception of interest rates and the TWI. I impose a variation of Restriction (6). I assume that the coefficients on GDPt and CPIt in the equation for CASHt are non-positive and the coefficient on TWIt is non-negative. I continue to impose the proxy-based restrictions alongside restrictions on the impulse responses of CASHt, CPIt and TWIt (i.e. there are sign restrictions on the cumulative impulse response of CPIt). The restrictions are therefore largely consistent with the restrictions imposed when the model is estimated in levels.
The response of output to the shock is qualitatively similar to that obtained when all variables enter the model in levels (Figure 8). In contrast, the robust credible intervals include positive price responses at horizons beyond one year, so price puzzles are no longer necessarily assigned low posterior probability.
Notes: Estimates obtained under a version of Restriction (6) modified to account for some variables entering the model in differences. Impulse responses are to a positive, standard deviation monetary policy shock.
5.2 Inflation-targeting period
The baseline specification uses an estimation sample that starts in the March quarter 1984 and ends in the December quarter 2019. This sample period is chosen with the objective of maximising the number of observations, which should improve the precision of the estimates, subject to limiting the amount of structural change that is likely to have occurred during the period. One concern with this sample period is that it includes a change in the monetary policy regime; the RBA began to target consumer price inflation in the early-to-mid 1990s. I therefore consider estimating the model over a shorter sample period in which the monetary policy regime was more plausibly constant.
It is difficult to be precise about the exact start of explicit inflation targeting by the RBA. However, there appears to be a rough consensus that inflation targeting was undertaken from at least 1993 (and possibly earlier). For example, speeches by the Governor at the time, Bernie Fraser, in 1992 and 1993 contain references to the practice of inflation targeting by the RBA (Fraser 1992, 1993a, 1993b). I therefore consider an estimation sample that begins in the March quarter 1993, although other choices of starting date could also be reasonable.
Under the shorter estimation sample, the robust credible intervals for the responses of output and prices include zero at most horizons (Figure 9). The evidence that output and prices fall following a monetary policy shock is weaker than that obtained using the full estimation sample; for example, the posterior lower probability that the output response is negative after two years is only about
40 per cent and the posterior lower probability that the response of prices is negative after three years is about 70 per cent. The sensitivity of the results to estimating the model over the inflation-targeting period is consistent with the idea that, because monetary policy has been conducted more systematically over this period, it is more difficult to identify monetary policy shocks and their effects (e.g. Ramey 2016).[25] Although the robust credible intervals are narrower in the inflation-targeting period (compare Figures 6 and 9), this seems to largely reflect that the impact response of the cash rate is more precisely estimated (or more tightly identified).
Notes: Estimates obtained under Restriction (6). Estimation sample begins in the March quarter 1993. Impulse responses are to a positive, standard deviation monetary policy shock.
5.3 Credit spreads
Beckers (2020) finds evidence to suggest that the cash rate responds to contemporaneous developments in credit conditions, as measured by credit spreads, even after controlling for the response of the cash rate to forecasts of economic conditions. Accordingly, I investigate the robustness of my results to adding a measure of money market spreads, MMSt, to the reduced-form VAR.[26] This variable is available from the September quarter 1992, but I set the estimation sample to be consistent with the exercise in Section 5.2 (i.e. the sample begins in the March quarter 1993). I also impose additional identifying restrictions related to credit spreads. Specifically, in addition to Restriction (6), I impose that the response of MMSt+h is non-negative for h = 0,1,2,3, so credit spreads cannot decline immediately following a positive monetary policy shock. Additionally, the coefficient on MMSt in the equation for CASHt is restricted to be non-negative, so the central bank does not increase the cash rate in response to higher credit spreads.
The results obtained under these restrictions are broadly similar to those obtained when estimating the model over the inflation-targeting period (Figure 10). One notable difference is that the robust credible intervals for the response of prices now exclude zero at many intermediate horizons. Consistent with this, the posterior lower probability that prices decline is around 90 per cent at horizons beyond one year. The difference in the responses of prices relative to the previous model reflect both the inclusion of credit spreads in the model as well as the additional identifying restrictions related to credit spreads. The posterior lower probability that output declines following the shock is fairly low at horizons shorter than around four years.[27]
Notes: Estimates obtained under a version of Restriction (6) augmented to account for credit spreads entering the model. Estimation sample begins in the March quarter 1993. Impulse responses are to a positive, standard deviation monetary policy shock.
5.4 Unemployment
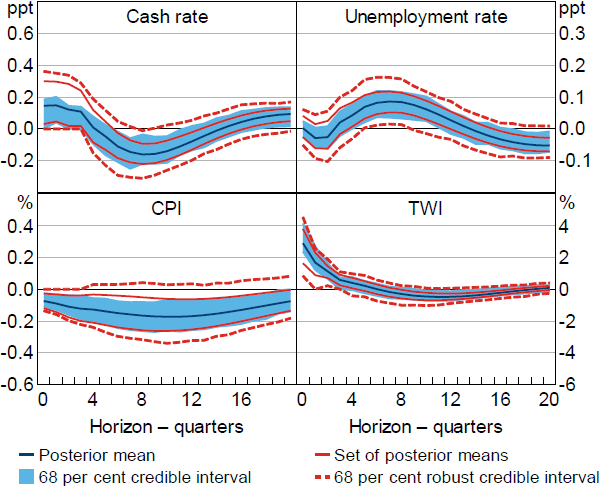
Given the RBA's mandate to pursue price stability and full employment, it may be more natural to impose restrictions on the systematic response of the cash rate to unemployment rather than to output. Additionally, given this mandate, the response of unemployment to a monetary policy shock is of interest. I therefore consider replacing GDPt in the VAR with the unemployment rate, URt. I impose that, all else equal, monetary policy is not tightened in response to higher unemployment. The restrictions are otherwise the same as in Restriction (6) and the response of the unemployment rate is left unrestricted.
Under these restrictions, the unemployment rate appears to increase in response to the shock (Figure 11); the posterior lower probability that the response of the unemployment rate is positive after two years is around 90 per cent. In response to a 100 basis point shock, the posterior lower probability that the response of the unemployment rate exceeds 0.25 percentage points is around 50 per cent and the lower probability that it exceeds 0.5 percentage points is less than 20 per cent. In comparison, the point estimates in Beckers (2020) suggest that the unemployment rate increases by a maximum of around one-third of a percentage point. The peak response of the unemployment rate in the MARTIN model is smaller than this, at a bit less than 0.15 percentage points. My estimates imply that there is a reasonably high posterior probability that the response of the unemployment rate is larger than in the MARTIN model; the posterior lower probability that the response of the unemployment rate two years after the shock exceeds the peak response in MARTIN is around 80 per cent.
Notes: Estimates obtained under a version of Restriction (6) modified to account for the unemployment rate replacing real GDP in the model. Impulse responses are to a positive, standard deviation monetary policy shock.
6. Conclusion
To estimate the effects of monetary policy in Australia, this paper imposes sign restrictions on impulse responses to a monetary policy shock, the monetary policy reaction function, and the relationship between a proxy for the monetary policy shock and the shock itself. The advantage of using these sign restrictions over traditional zero restrictions is that the sign restrictions are less restrictive and arguably less controversial, in the sense that they are consistent with a wide range of conventional macroeconomic models and/or prior information. The approach to inference that I take explicitly addresses the problem of posterior sensitivity to the choice of prior that arises when conducting Bayesian inference under sign restrictions, which turns out to be important.
Together, the sign restrictions that I consider appear to be reasonably informative about the effects of a standard deviation monetary policy shock on output and prices; output and prices fall with high posterior probability at horizons beyond a year or so, and this result is robust to the choice of prior. However, the restrictions appear to be quite uninformative about responses to a 100 basis point monetary policy shock, which are the responses that are more relevant from a policymaking perspective, reflecting the fact that they do not necessarily rule out extremely small (or zero) responses of the cash rate to a monetary policy shock. Nevertheless, it remains possible to draw some useful inferences about the effects of a 100 basis point shock. For example, in response to a 100 basis point shock, there is strong evidence that output declines by at least half a per cent at the two-year horizon. The results are consistent with the output effects of a change in the cash rate lying towards the upper end of the range of existing estimates and, in particular, the results suggest that the response of output is likely to exceed the peak responses in the RBA's multi-sector and MARTIN models. One caveat around these results is that they are sensitive to shortening the estimation sample to the inflation-targeting period.
The results in this paper could be further refined by imposing additional credible identifying restrictions. For example, restrictions on the sign of the monetary policy shock or its relative contribution to changes in the cash rate in specific historical episodes could sharpen identification (e.g. Antolín-Díaz and Rubio-Ramírez 2018; Giacomini, Kitagawa and Read 2021a). Another potentially useful avenue would be to identify other structural shocks, which should in principle help to identify monetary policy shocks. The availability of additional proxies for Australian macroeconomic shocks would be useful in this regard. More generally, it is important that we continue to search for credible identifying restrictions and question the assumptions underlying existing estimates of the effects of monetary policy.
Appendix A: Algorithms for Inference
This appendix describes the algorithms used to conduct inference in the body of the paper. I first outline a generic algorithm. I then provide details on how the different steps of the algorithm are implemented in practice, since implementation differs across different types of identifying restrictions.
Algorithm A1 (robust Bayesian inference). Assume the parameter of interest is .
For k = 1,...,K:
Step 1: Draw from .
Step 2: Check whether the identified set is empty. If so, return to Step 1. If not, proceed to Step 3.
Step 3: Compute
Given the output of Algorithm A1, the set of posterior means is approximated by the interval
Define , and let be the sample th quantile of An approximated shortest robust credible interval for (with credibility ) is an interval centred at with radius If D is some hypothesis about (i.e. that the parameter lies within some specified interval), the posterior lower probability assigned to the hypothesis can be approximated by the posterior probability that the identified set is contained entirely within the interval D (, where 1(·) is the indicator function). The posterior upper probability can be approximated by the posterior probability that the identified set intersects the interval
How Steps 2 and 3 are implemented depends on the nature of the identifying restrictions imposed; in particular, whether the identifying restrictions constrain a single column of Q or multiple columns. I discuss these steps below.
A.1 Determining whether the identified set is empty
Step 2 of Algorithm A1 requires determining whether the identified set for Q, , is empty. There are different algorithms available to do this. The applicability and efficiency of the different algorithms depends on the type of sign restrictions imposed.
When the sign restrictions constrain a single column of Q only, which is the case under Restrictions (1)–(5), I use the algorithm proposed in Giacomini, Kitagawa and Volpicella (2022). This algorithm relies on the fact that any non-empty identified set for q1 must contain a vertex on the unit sphere in where n–1 restrictions are active (i.e. binding). The algorithm proceeds by considering different combinations of n–1 active sign restrictions, computing a unit-length vector that satisfies these restrictions with equality and checking whether this vector (or its negative) satisfies the remaining sign restrictions. In practice, one can compute the vector satisfying the active sign restrictions by computing an orthonormal basis for the null space of , where is an (n–1)×n matrix containing a selection of n–1 of the sign restrictions in . If a vector satisfying the restrictions is found, the identified set is non-empty. If no such vector is found after considering all possible combinations of restrictions, the identified set is empty.
When the sign restrictions constrain multiple columns of Q, which is the case under Restriction (6), I use the rejection-sampling approach described in Giacomini and Kitagawa (2021). This involves drawing Q from a uniform distribution over the space of orthonormal matrices, normalising the draw so that the diagonal elements of A0 are non-negative, and checking whether the draw satisfies the sign restrictions. If, after a very large number of draws, no draw of Q satisfies the sign restrictions, the identified set is approximated as being empty. A problem with this approach is that it may misclassify the identified set as being empty when it is in fact non-empty. The chance of this happening increases when the sign restrictions substantially truncate the identified set given the sign normalisations. In practice, I obtain 100,000 draws of Q that do not satisfy the sign restrictions before approximating the identified set as empty.
When a value of Q is obtained satisfying the sign restrictions, it can be treated as a draw from the uniform distribution over These draws are used to conduct standard Bayesian inference under the conditionally uniform prior.
When interest is in the impulse responses to a 100 basis point monetary policy shock (Section 4), I check whether using the approaches described in Read (2022b). Under Restriction (3), the number of sign restrictions is equal to the number of endogenous variables in the VAR, so the sufficient condition in Proposition 4.2 of Read (2022b) applies and for all values of . Otherwise, the posterior probability that is approximated by augmenting the set of sign restrictions with the zero restriction and numerically checking whether the associated identified set is non-empty at each draw of . Under Restrictions (1), (2), (4) and (5), I use Algorithm 4.1 in Read (2022a), which requires solving a simple linear program. Under Restriction (6), I use the rejection sampling approach from Giacomini and Kitagawa (2021) (i.e. draw a value of Q satisfying and check whether it satisfies the remaining sign restrictions).
A.2 Computing the bounds of the identified set
Step 3 of Algorithm A1 requires computing the bounds of the identified set. Again, there are different algorithms available to do this.
When the sign restrictions constrain a single column of Q only, which is the case under Restrictions (1)–(5), I apply the active-set algorithm proposed in Gafarov et al (2018). Given a set of active restrictions, these authors provide analytical expressions (up to sign) for the value function and solution of the optimisation problem that defines and . Their algorithm proceeds by computing these quantities at every possible combination of active restrictions and checking whether the corresponding solution satisfies the non-active sign restrictions (i.e. whether the potential solution is feasible). and are then computed as the minimum and maximum, respectively, of the feasible values across the different sets of active restrictions.
The analytical expression for the potential solution of the optimisation problem provided by Gafarov et al (2018) is undefined when the value of the optimisation problem is equal to zero. In this case, the authors note that it is necessary to check whether there exists a vector that satisfies the active restrictions with equality and any non-active sign restrictions, but they do not explain how this should be done. When the number of active restrictions is strictly less than n–1, I apply an algorithm proposed in Read (2022a) to determine whether the identified set is non-empty given a set of sign and zero restrictions. When the number of active restrictions is equal to n–1, I compute an orthonormal basis for the null space of the matrix containing the coefficients of the active restrictions. By the rank-nullity theorem, this null space is one-dimensional (i.e. a vector). I then check whether this vector (or its negative) satisfies the remaining sign restrictions, in which case the corresponding solution is feasible.
When the sign restrictions constrain multiple columns of Q, which is the case under Restriction (6), I compute the bounds of the identified set using the rejection-sampling algorithm proposed in Giacomini and Kitagawa (2021). Specifically, I approximate the bounds of the identified set by obtaining 5,000 draws of Q from a uniform distribution over and computing the minimum and maximum of the impulse response over these draws. A drawback of this approach is that the approximated identified set will be too narrow, although – when the identified set is bounded – the approximation error will vanish as the number of draws of Q increases.[28]
A.3 Approximation errors associated with Restriction (6)
It is possible that the identified set is misclassified as empty at some draws of under Restriction (6), because the algorithm used to determine whether the identified set is empty is only approximate in the case where multiple columns of Q are restricted. The posterior plausibility obtained under Restriction (6) is therefore a lower bound on the ‘true’ posterior plausibility. This approximation error may also tend to make the reported sets of posterior means and robust credible intervals wider than they actually are, since the algorithm will be more likely to discard reduced-form parameters that yield a ‘narrow’ identified set. On the other hand, at any given value of that has a non-empty identified set, the algorithm used to approximate the identified set will yield an approximation that is too narrow. It is therefore unclear whether the ‘true’ informativeness of the restrictions – in terms of how much the restrictions tighten the set of posterior means – will be under or overstated. Experiments suggest that the results are fairly insensitive to increases in the number of draws used to check whether the identified set is empty or to approximate the bounds of the identified set.
Appendix B: Data
| Variable | Details | Source |
|---|---|---|
| Cash rate | Interbank overnight cash rate, %, quarterly average | RBA statistical table F1.1 Interest Rates and Yields – Money Market |
| Real GDP | Chain volume measure, $m, seasonally adjusted | ABS Cat No 5206.0 ‘Australian National Accounts: National Income, Expenditure and Product’ |
| Trimmed mean CPI | Excluding interest and tax changes, index, seasonally adjusted | ABS Cat No 6401.0 ‘Consumer Price Index, Australia’; data for the period prior to September 2002 are calculated by the RBA using the ABS methodology |
| Trade-weighted exchange rate index | Australian dollar trade-weighted exchange rate, index, end of period | ABS Cat No 5202.0 ‘Balance of Payments and International Investment Position, Australia’ |
| Terms of trade | Goods and services terms of trade, index, seasonally adjusted | ABS Cat No 5302.0 ‘Balance of Payments and International Investment Position, Australia’ |
| US real GDP | Chain volume measure, $b, seasonally adjusted | Federal Reserve Bank of St. Louis, FRED database (identifier GDPC1) |
| Federal funds rate | Effective federal funds rate, %, quarterly average | Federal Reserve Bank of St. Louis, FRED database (identifier FEDFUNDS) |
| Proxy for monetary policy shock | ‘Unanticipated’ series from Beckers (2020) | Supplementary information from Beckers (2020) |
| Money market spread | Percentage point difference between the 3-month bank-accepted bill rate and a 3-month risk-free interest rate. After the September quarter 2001, the risk-free rate is the 3-month Australian dollar overnight indexed swap (OIS) rate. Before the September quarter 2001, it is an estimated 3-month zero-coupon forward rate based on the approach in Finlay and Olivan (2012). | RBA statistical table F1.1 Interest Rates and Yields – Money Market and Historical data: F17 Zero-coupon Interest Rates – Analytical Series – 1992 to 2008 |
| Unemployment rate | %, derived from the quarterly average of seasonally adjusted unemployed persons and the quarterly average of seasonally adjusted labour force | ABS Cat No 6202.0 ‘Labour Force, Australia’ |
References
Antolín-Díaz J and JF Rubio-Ramírez (2018), ‘Narrative Sign Restrictions for SVARs’, The American Economic Review, 108(10), pp 2802–2829.
Arias JE, D Caldara and JF Rubio-Ramírez (2019), ‘The Systematic Component of Monetary Policy in SVARs: An Agnostic Identification Procedure’, Journal of Monetary Economics, 101, pp 1–13.
Arias JE, JF Rubio-Ramírez and DF Waggoner (2018), ‘Inference Based on Structural Vector Autoregressions Identified with Sign and Zero Restrictions: Theory and Applications’, Econometrica, 86(2), pp 685–720.
Arias JE, JF Rubio-Ramírez and DF Waggoner (2021), ‘Inference in Bayesian Proxy-SVARs’, Journal of Econometrics, 225(1), pp 88–106.
Ballantyne A, T Cusbert, R Evans, R Guttmann, J Hambur, A Hamilton, E Kendall, R McCririck, G Nodari and D Rees (2019), ‘MARTIN Has Its Place: A Macroeconometric Model of the Australian Economy’, RBA Research Discussion Paper No 2019-07.
Baumeister C and JD Hamilton (2015), ‘Sign Restrictions, Structural Vector Autoregressions, and Useful Prior Information’, Econometrica, 83(5), 1963–1999.
Beckers B (2020), ‘Credit Spreads, Monetary Policy and the Price Puzzle’, RBA Research Discussion Paper No 2020-01.
Berkelmans L (2005), ‘Credit and Monetary Policy: An Australian SVAR’, RBA Research Discussion Paper No 2005-06.
Bishop J and P Tulip (2017), ‘Anticipatory Monetary Policy and the “Price Puzzle”’, RBA Research Discussion Paper No 2017-02.
Braun R and R Brüggemann (forthcoming), ‘Identification of SVAR Models by Combining Sign Restrictions with External Instruments’, Journal of Business & Economic Statistics.
Brischetto A and G Voss (1999), ‘A Structural Vector Autoregression Model of Monetary Policy in Australia’, RBA Research Discussion Paper No 1999-11.
Caggiano G and E Castelnuovo (2021), ‘Global Uncertainty’, Australian National University Crawford School of Public Policy, Centre for Applied Macroeconomic Analysis, CAMA Working Paper 21/2021.
Castelnuovo E, G Pellegrino and G Ranzato (2022), ‘Delayed Overshooting Puzzle: Does Systematic Monetary Policy Matter?’, University of Padova, Department of Economics and Management ‘Marco Fanno’, Marco Fanno Working Paper No 280.
Del Negro M and F Schorfheide (2011), ‘Bayesian Macroeconometrics’, in J Geweke, G Koop and H van Dijk (eds), Oxford Handbook of Bayesian Econometrics, Oxford University Press, Oxford, pp 293–389.
Dornbusch R (1976), ‘Expectations and Exchange Rate Dynamics’, Journal of Political Economy, 84(6), pp 1161–1176.
Dungey M and A Pagan (2000), ‘A Structural VAR Model of the Australian Economy’, Economic Record, 76(235), pp 321–342.
Dungey M and A Pagan (2009), ‘Extending a SVAR Model of the Australian Economy’, Economic Record, 85(268), pp 1–20.
Finlay R and D Olivan (2012), ‘Extracting Information from Financial Market Instruments’, RBA Bulletin, March, pp 45–54.
Fisher LA and H-S Huh (2022), ‘Systematic Monetary Policy in a SVAR for Australia’, Yonsei University, Economic Research Institute Working Paper 2022RWP-194.
Fraser B (1992), ‘“Two Perspectives on Monetary Policy”’, Talk to a Conference in Honour of Don Sanders, Sydney, 17 August.
Fraser B (1993a), ‘Some Aspects of Monetary Policy’, Talk to Australian Business Economists (ABE), Sydney, 31 March.
Fraser B (1993b), ‘Talk by Governor’, Talk to the CEDA Symposium entitled ‘An Australia That Works: A Vision for the Future’, Sydney, 4 August.
Gafarov B, M Meier and JL Montiel Olea (2018), ‘Delta-Method Inference for a Class of Set-Identified SVARs’, Journal of Econometrics, 203(2), pp 316–237.
Gertler M and P Karadi (2015), ‘Monetary Policy Surprises, Credit Costs, and Economic Activity’, American Economic Journal: Macroeconomics, 7(1), pp 44–76.
Giacomini R and T Kitagawa (2021), ‘Robust Bayesian Inference for Set-Identified Models’, Econometrica, 89(4), pp 1519–1556.
Giacomini R, T Kitagawa and M Read (2021a), ‘Identification and Inference under Narrative Restrictions’, Unpublished manuscript, University College London, 15 February. Available at <https://doi.org/10.48550/arXiv.2102.06456>.
Giacomini R, T Kitagawa and M Read (2021b), ‘Robust Bayesian Analysis for Econometrics’, Centre for Economic Policy Research Discussion Paper DP16488.
Giacomini R, T Kitagawa and M Read (2022a), ‘Narrative Restrictions and Proxies: Rejoinder’, Journal of Business & Economic Statistics, 40(4), pp 1438–1441.
Giacomini R, T Kitagawa and M Read (2022b), ‘Robust Bayesian Inference in Proxy SVARs’, Journal of Econometrics, 228(1), pp 107–126.
Giacomini R, T Kitagawa and A Volpicella (2022), ‘Uncertain Identification’, Quantitative Economics, 13(1), pp 95–123.
Gibbs CG, J Hambur and G Nodari (2018), ‘DSGE Reno: Adding a Housing Block to a Small Open Economy Model’, RBA Research Discussion Paper No 2018-04.
Granziera E, HR Moon and F Schorfheide (2018), ‘Inference for VARs Identified with Sign Restrictions’, Quantitative Economics, 9(3), pp 1087–1121.
Jääskelä J and D Jennings (2010), ‘Monetary Policy and the Exchange Rate: Evaluation of VAR Models’, RBA Research Discussion Paper No 2010-07.
Jääskelä J and P Smith (2011), ‘Terms of Trade Shocks: What are They and What Do They Do?’, RBA Research Discussion Paper No 2011-05.
Jacobs D and V Rayner (2012), ‘The Role of Credit Supply in the Australian Economy’, RBA Research Discussion Paper No 2012-02.
Kilian L and H Lütkepohl (2017), Structural Vector Autoregressive Analysis, Themes in Modern Econometrics, Cambridge University Press, Cambridge.
Kim S and K Lim (2018), ‘Effects of Monetary Policy Shocks on Exchange Rates in Small Open Economies’, Journal of Macroeconomics, 56, pp 324–339.
Lawson J and D Rees (2008), ‘A Sectoral Model of the Australian Economy’, RBA Research Discussion Paper No 2008-01.
Liu P (2008), ‘The Role of International Shocks in Australia's Business Cycle’, RBA Research Discussion Paper No 2008-08.
Ludvigson SC, S Ma and S Ng (2017), ‘Shock Restricted Structural Vector-Autoregressions’, NBER Working Paper No 23225, rev January 2020.
Manalo J, D Perera and D Rees (2014), ‘Exchange Rate Movements and the Australian Economy’, RBA Research Discussion Paper No 2014-11.
Montiel Olea JL and J Nesbit (2021), ‘(Machine) Learning Parameter Regions’, Journal of Econometrics, 222(1, Part C), pp 716–744.
Moon HR and F Schorfheide (2012), ‘Bayesian and Frequentist Inference in Partially Identified Models’, Econometrica, 80(2), pp 755–782.
Piffer M and M Podstawski (2018), ‘Identifying Uncertainty Shocks Using the Price of Gold’, The Economic Journal, 128(616), pp 3266–3284.
Plagborg-Møller M (2019), ‘Bayesian Inference on Structural Impulse Response Functions’, Quantitative Economics, 10(1), pp 145–184.
Poirier DJ (1998), ‘Revising Beliefs in Nonidentified Models’, Econometric Theory, 14(4), pp 483–509.
Ramey VA (2016), ‘Macroeconomic Shocks and Their Propagation’, in JB Taylor and H Uhlig (eds), Handbook of Macroeconomics: Volume 2A, Handbooks in Economics, Elsevier, Amsterdam, pp 71–162.
Read M (2022a), ‘Algorithms for Inference in SVARs Identified with Sign and Zero Restrictions’, The Econometrics Journal, 25(3), pp 699–718.
Read M (2022b), ‘The Unit-Effect Normalisation in Set-Identified Structural Vector Autoregressions’, RBA Research Discussion Paper No 2022-04.
Romer CD and DH Romer (2004), ‘A New Measure of Monetary Shocks: Derivation and Implications’, The American Economic Review, 94(4), pp 1055–1084.
Rothenberg TJ (1971), ‘Identification in Parametric Models’, Econometrica, 39(3), pp 577–591.
Rubio-Ramírez JF, DF Waggoner and T Zha (2010), ‘Structural Vector Autoregressions: Theory of Identification and Algorithms for Inference’, The Review of Economic Studies, 77(2), pp 665–696.
Stock JH and MW Watson (2016), ‘Dynamic Factor Models, Factor-Augmented Vector Autoregressions, and Structural Vector Autoregressions in Macroeconomics’, in JB Taylor and H Uhlig (eds), Handbook of Macroeconomics: Volume 2A, Handbooks in Economics, Elsevier, Amsterdam, pp 415–525.
Stock JH and MW Watson (2018), ‘Identification and Estimation of Dynamic Causal Effects in Macroeconomics Using External Instruments’, The Economic Journal, 128(610), 917–948.
Suzuki T (2004), ‘Is the Lending Channel of Monetary Policy Dominant in Australia?’, The Economic Record, 80(249), pp 145–156.
Uhlig H (2005), ‘What Are the Effects of Monetary Policy on Output? Results from an Agnostic Identification Procedure’, Journal of Monetary Economics, 52(2), pp 381–419.
Wolf CK (2020), ‘SVAR (Mis)Identification and the Real Effects of Monetary Policy Shocks’, American Economic Journal: Macroeconomics, 12(4), pp 1–32.
Wu JC and FD Xia (2016), ‘Measuring the Macroeconomic Impact of Monetary Policy at the Zero Lower Bound’, Journal of Money, Credit and Banking, 48(2-3), pp 253–291.
Acknowledgements
I thank Alexander Ballantyne, Benjamin Beckers, Anthony Brassil, Efrem Castelnuovo, Thomas Cusbert, Luci Ellis, Jonathan Hambur, Jarkko Jääskelä, John Simon and Brian Tran for helpful feedback. I also thank Shayan Omidi for providing estimates from the MARTIN model. The views expressed in this paper are my own and do not necessarily reflect the views of the Reserve Bank of Australia. I am solely responsible for any errors.
Footnotes
I make no distinction between the effects of anticipated (or ‘systematic’) changes in the cash rate and unanticipated changes (i.e. monetary policy shocks), since the effects are the same given an appropriately defined counterfactual path for the cash rate. In defining the causal effect of an anticipated change in the cash rate, one needs to specify a counterfactual path for the cash rate against which the anticipated response can be compared; the difference between these paths can be represented by a monetary policy shock (or sequence of shocks). [1]
I talk about ‘identifying a monetary policy shock’ as shorthand for ‘identifying the effects of a monetary policy shock’, since the two are equivalent; the effects of the shock are identified if the shock itself is identified and vice versa. [2]
Bayesian inference under the assumption of homoskedastic, normally distributed structural shocks can be interpreted asymptotically as a limited-information procedure based on the second moments of the data; for discussion of this point, see Plagborg-Møller (2019). [3]
See Stock and Watson (2016) or Kilian and Lütkepohl (2017) for overviews of identification in SVARs. See Giacomini and Kitagawa (2021) for more information about the construction of . [4]
This approach to conducting inference in SVARs under sign restrictions is ubiquitous in the empirical literature. An alternative approach is to conduct Bayesian inference under a prior that is specified directly over the structural parameters of the SVAR, as advocated for in Baumeister and Hamilton (2015). There are also frequentist approaches, although these have not (yet) been adopted widely (e.g. Gafarov, Meier and Montiel Olea 2018; Granziera, Moon and Schorfheide 2018). [5]
Giacomini, Kitagawa and Read (2021b) review the literature on robust Bayesian analysis in econometrics, and describe different approaches to conducting robust Bayesian inference in set-identified SVARs. [6]
Giacomini and Kitagawa (2021) provide sufficient conditions under which this approach is valid from a frequentist perspective, in the sense that the set of posterior means is consistent for the true identified set and the robust credible interval has asymptotically correct frequentist coverage of the true identified set. This approach therefore reconciles the asymptotic disagreement between frequentist and Bayesian methods that arises in set-identified models (Moon and Schorfheide 2012), as well as having a well-defined (robust) Bayesian interpretation in finite samples. [7]
Over the period following the global financial crisis, the federal funds rate was constrained by the zero lower bound and unconventional monetary policy was used to deliver stimulus to the US economy. The federal funds rate was therefore an imperfect indicator of the stance of US monetary policy during this period. I obtain similar results if I instead splice the federal funds rate with the ‘shadow federal funds rate’ constructed by Wu and Xia (2016), which is the predicted short rate from a model of the term structure of interest rates that does not feature a lower bound. [8]
Uhlig (2005) imposes additional restrictions that are designed to disentangle monetary policy shocks from shocks to money demand. Since my SVAR does not include any monetary aggregates, I do not consider such restrictions. Kim and Lim (2018) impose similar restrictions in models of several small open economies, including Australia. [9]
The results are similar when imposing the restrictions on impact only. [10]
The credible intervals presented under the standard Bayesian approach to inference are highest posterior density intervals, which are the shortest intervals that cover 68 per cent of the posterior. [11]
Arias et al (2019) note that central banks do not have access to contemporaneous data on output and prices when setting the policy rate. However, they typically have access to rich data that allows them to accurately nowcast these variables. Rather than modelling the process of information acquisition and nowcasting, their approach makes the simplifying assumption that the central bank has access to data on current output and prices when setting policy. They also impose zero restrictions on the coefficients of some monetary aggregates in the monetary policy reaction function, but such variables are not included in my model. [12]
The RBA's multi-sector model of the Australian economy includes the change in the real exchange rate in the Taylor rule (Gibbs et al 2018). The posterior mean of the coefficient on this variable is negative, but close to zero. [13]
The coefficient on the exchange rate (a14) does not represent the change in the cash rate in response to a 1 per cent appreciation, because the coefficient on CASHt (a11) is not normalised to equal one. The change in the cash rate in response to a 1 per cent appreciation (holding all else equal) would be −a14/a11. [14]
Castelnuovo, Pellegrino and Ranzato (2022) also consider imposing this restriction in the US context. They justify the restriction on the basis of narrative evidence. [15]
To estimate the effects of monetary policy shocks in Australia, Beckers (2020) includes the (cumulated) purged measure of the cash rate in an SVAR and imposes additional zero restrictions on the structural parameters (i.e. he does not use a proxy SVAR). [16]
These restrictions are also considered in Braun and Brüggemann (forthcoming). In a similar vein, Ludvigson, Ma and Ng (2017), Piffer and Podstawski (2018), Arias, Rubio-Ramírez and Waggoner (2021), Caggiano and Castelnuovo (2021) and Giacomini, Kitagawa and Read (2022b) impose sign restrictions on the correlations between structural shocks and variables that are external to the VAR. [17]
I write this restriction in terms of the covariance, but it is equivalent to a restriction on the correlation; to write the restriction in terms of the correlation, divide by . [18]
More generally, the fact that the VAR excludes information to which monetary policy responds (in particular, information summarised by the RBA's forecasts) means that the ‘true’ monetary policy shock may not be invertible (i.e. not recoverable as a linear combination of the reduced-form VAR innovations). However, if the true monetary policy shock is ‘close to’ invertible, it may still be possible to accurately identify the effects of the shock (Wolf 2020). It would be interesting to explore how misspecification of the reaction function in the SVAR affects identification when an externally generated proxy is available from an estimated reaction function that is plausibly (close to) correctly specified. [19]
The measured informativeness of the restrictions is similar when averaging over horizons. [20]
Approximation errors associated with the algorithm used to check if the identified set is non-empty mean that the posterior plausibility of Restriction (6) may be understated. Similarly, numerical approximation errors mean that the informativeness of Restriction (6) may be under or overstated. I attempt to minimise both problems by using a large number of draws of Q in the numerical approximation algorithms. See Appendix A for further details. [21]
The responses to any fixed-size shock (e.g. a 25 basis point shock) can be obtained by linearly rescaling the responses to a 100 basis point shock. The identified set for the response to any given fixed-size shock is consequently unbounded if and only if the identified set for the response to a 100 basis point shock is unbounded. [22]
If is the posterior lower probability assigned to the hypothesis , the posterior upper probability assigned to the hypothesis is . [23]
See Ballantyne et al (2019) for a description of the MARTIN model. The estimates I refer to are from the current version of the model, which differs in some ways from the version described in Ballantyne et al. Note also that the impulse responses to a monetary policy shock presented in Figure 12 of Ballantyne et al correspond to a 100 basis point increase in the cash rate that persists for four quarters, so they are not comparable to the responses discussed in this paper. [24]
Estimating the model in first differences using the inflation-targeting sample (e.g. combining the exercises in Sections 5.1 and 5.2) yields even weaker evidence that output and prices fall. [25]
The measure of money market spreads follows that constructed in Beckers (2020). See Appendix B for details. [26]
The observation that the proxy appears to contain useful identifying information in this model suggests that the apparent informativeness of the proxy-based restriction is not purely due to the VAR omitting relevant information about credit spreads; see the discussion in footnote 19. [27]
When approximating identified sets for the elements of a d-dimensional vector, Montiel Olea and Nesbit (2021) derive bounds for the number of draws that are required to achieve an approximation error that is at most some value with at least some probability. Based on their upper bound for the number of draws, using 5,000 draws of Q is consistent with an approximation error of at most 9 per cent with probability close to 100 per cent. [28]