RBA Annual Conference – 1991 Competition: Profitability and Margins Les Phelps[1]
1. Introduction
The subject of this paper flows from the reasonable expectation that deregulation should have facilitated competition between Australian financial intermediaries which should in turn have encouraged efficiencies of operation. Enhanced competition should then have ensured that the savings gained from those efficiencies were not captured entirely by the shareholders or the staff of the banks but passed to the customers in the form of either:
- a greater diversity of services for the same cost;
- reduced fees for existing services;
- a smaller differential between interest rates paid by banks on deposits and those charged on loans (since the monetary authorities determine the general level of interest rates, it is only this differential which is the prerogative of the financial intermediaries. There is no reason for either borrowers or depositors to gain all the benefits);
- a greater supply of loans from banks which do not get repaid (this final mechanism was largely unforeseen but in the event was an important channel).
The difference between interest rates paid and those charged by banks has been the subject of some controversy in Australia in the past year. The former Treasurer expressed concern that, from his perspective, the banks have been slow to pass on to their borrowers the benefits which reductions in official interest rates have had on banks' cost of funds.
Banks have responded on two fronts. They have argued that interest rate margins in 1989 (when cash rates got to 18 per cent while mortgage rates were 17 per cent) were unrealistically low. Thus a return to “normal” implied some widening from 1989 levels. However, banks have argued that margins in 1991 are still narrower than they were when deregulation began in earnest around 10 years ago.
The primary focus of this paper is the latter point. We investigate whether deregulation has been associated with an improvement in the efficiency of Australian banks over the past decade and, if so, whether the cost savings have been passed on to the Australian consumer of banking services through narrower domestic interest rate margins.
In evidence presented in the 1989 Budget papers and to the Martin Inquiry, a lot has been made of the reduction over the past decade in the ratios for the Australian banks of operating costs and net interest income to assets from over 4 per cent to around 3 per cent. In other words, the community is being told that the cost to the community of each $100 intermediated by the banks has fallen from $4 to $3. Healthy scepticism seems the only plausible response to the notion that there was an improvement in banking productivity in Australia of the order of 25/30 per cent in the period between 1982 and 1991. Productivity gains in Australian industry generally have been glacier-like.
It also helps to stop and think from the outset whether it should cost $3 for a bank to raise $100 in deposits and on-lend it, i.e. would it cost $3,000 (five person weeks of wages) for a bank to raise $100,000 in deposits and make one housing loan. Intuition suggests that a fair slice of “payments systems” costs must be loaded into this $3 margin per $100 of assets.
(a) Determinants of the Ratio of Costs to Assets
In my view, the two key influences driving down the ratio for Australian banks for operating costs to average assets in the 1980s were:
- the interaction of subdued (by Australian standards) wage inflation and exuberant (by anyone's standards) asset growth; and
- the sharp increase in the volume of business done in “big ticket/low margin” business especially in international markets.
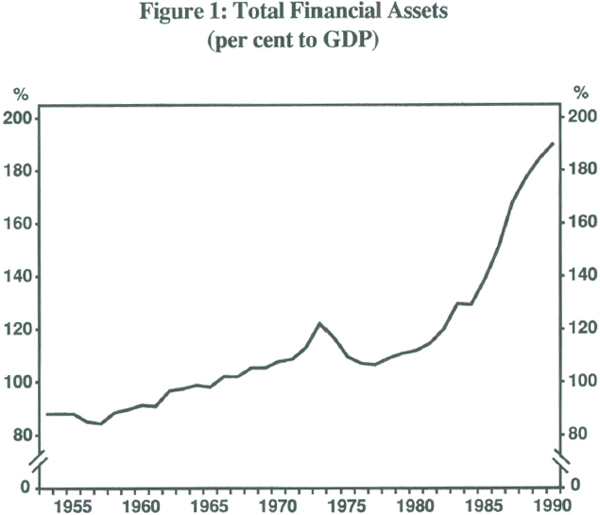
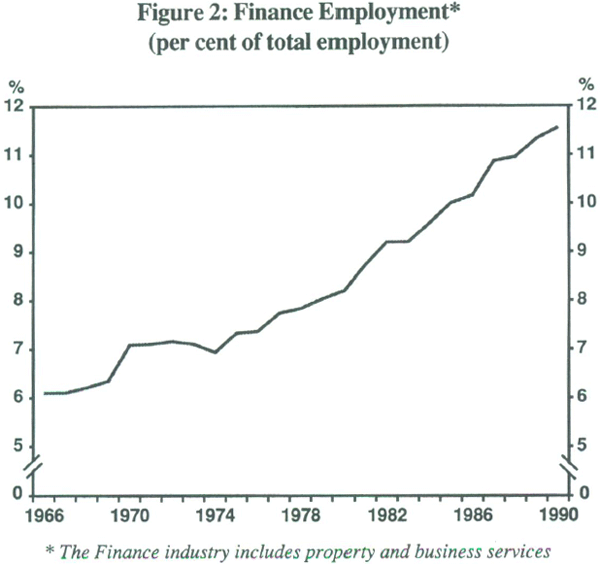
Figures 1 and 2 indicate quite clearly that any efficiencies at the “macro” level (for the financial sector as a whole) were gained by doing a greatly accelerated volume of financing with a steadily growing proportion of the Australian workforce.
If ratios of costs and net interest income to average assets have fallen because financiers were doing a greatly accelerated volume of business particularly in the “big-ticket” area, it should come as no surprise then that hard evidence of improved efficiency and lower margins in the domestic retail business of Australian financial intermediaries is hard to find. We present data to show that for Australia's building societies, which are domestic retail operations, ratios of net interest income and operating costs to average assets have not fallen.
Milbourne and Cumberworth from the University of New South Wales in their study “Australian Banking Performance in an Era of Deregulation: An Untold Story?” (1990), found some evidence that retail margins had widened.
(b) Some Australian History
“Costs and margins in banking” is not a subject which has found its way to the top of the totem pole very often in Australia. In the 1960s and 1970s the regulators had a big hand in controlling revenue as they effectively set both the margins and the volumes of banking business. The other half of the profitability equation, banking costs, was left for individual banks to worry about.
The growth in wage costs in the 1970s in an environment where regulators were limiting growth in the volume of banking business with their various brands of monetary targeting and fixing margins with their interest rate controls, forced banks to look for increased fee income to square the circle.
Fees for service were not regulated, but the absolute hatred of the Australian public for paying clearly-identified bank charges constituted an effective limiting force. This produced occasional episodes where increases in fees had the public and politicians demanding enquiries into banking costs. Such an episode produced the move towards greater disclosure of banking profitability which around 1980 saw the end of “hidden reserves” and produced sets of accounts from which it was possible to draw the startling revelation that Australian banks did occasionally have loans that went bad.
In an economy where industrial relations make micro-reform extremely difficult and the mind-set of Australian managers was to build up enough market share to justify the expensive branch networks needed to service a country the size of Australia with a widely-dispersed population, the scope for Australian banks to do much fine tuning on costs was limited. Controlling costs meant limiting growth in staff numbers and searching for ways to substitute technology for people. The leading edge of banking competition in Australia in the 1970s was technology. Each bank wished to be the first to lead Australia into the “paperless society”. Indeed, it is only through the substitution of technology for people that sustainable improvements in banking efficiency will be achieved.
For example, the present zeal of the major private banks for cutting staff is driven by their parlous profit performances in 1990 and 1991. While fewer staff can work harder to get the job done, unless there are real productivity improvements some backsliding could be expected as profitability improves.
Deregulation of interest rates in Australia happened over an extended period. It began in 1969 when banks were allowed freedom to set interest rates on certificates of deposit issued in large amounts. The next major step was 1972 when similar freedom was extended to rates charged on large loans. It finished in 1986 when limits were taken off mortgage loans. I think it is fair to say that 20 years of freedom to set margins on large transactions generated much less heat for banks than five years of “freedom” on mortgage rates.
(c) And Do Not Forget the End of Exchange Control
The deregulation which probably had the greatest impact on the aggregate interest rate margins and spreads published by Australian banks was the floating of the currency and the ending of Exchange Control. This allowed Australian banks to borrow and lend freely in foreign currencies and foreign banks, not just those that were subsequently given licences to operate in Australia as banks, to do the same in Australian dollars. Margins for “big-ticket” business for Australian customers were now set in the global marketplace, reflecting the cost structures of the thousands of banks which participated in that market and the intricacies of many countries' tax arrangements.
The cost of funds became pretty much a given in each currency for all potential lenders; competition focussed on the margin for risk and the extent to which the lending banker intruded on the affairs of the borrower.
Suffice to say at this juncture that margins on international business were slim relative to the average margin achieved in Australia. This reflected the intensely-competitive nature of the markets the Australian banks were attempting to enter offshore, the fact that it was essentially corporate or “big-ticket” business and that its pricing did not have to carry the burden of a domestic payments system.
To test whether the competitive forces unleashed by deregulation produced efficiencies which in turn allowed Australian banks to operate on skinnier margins, we need to be able to observe separately what has happened at either end of the banking market – retail versus wholesale, personal versus corporate, with the payments system in and with it out. Unfortunately, statistics are not available which would allow a comparison of costs and margins plus fees in, say, residential mortgage lending in Australia 1965 to 1991. That would be too easy!
(d) Measuring Costs and Margins
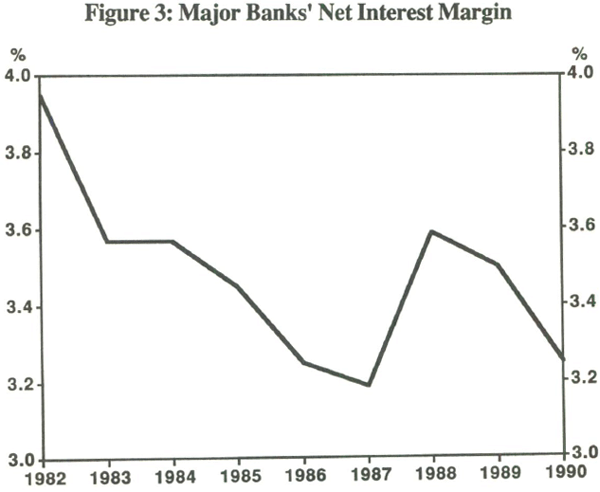
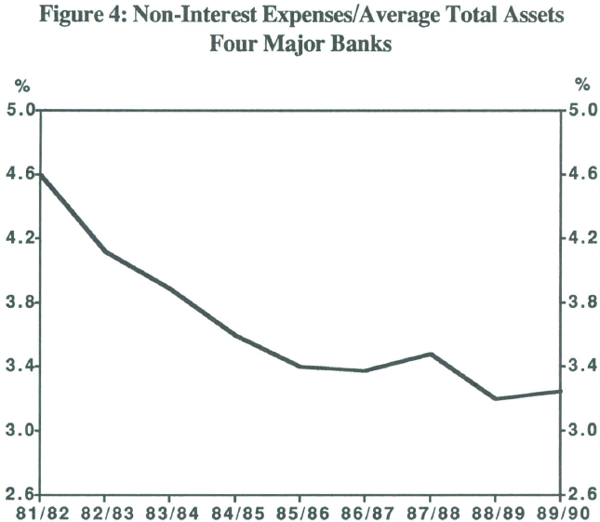
The figures below which have been reproduced in various forms over the past couple of years[2] show that for the four major Australian banks net interest income as a proportion of average assets fell from just under 4.0 per cent in 1982 to around 3.25 per cent in 1990. Over the same period, the ratio of non-interest expenses (excluding bad debt provisioning costs) to average assets fell from 4.6 per cent to around 3.2 per cent.
National Australia Bank (NAB), in its submission to the Martin Inquiry, concluded thus:
“Overall net interest income relative to assets is now lower than it was at the start of the 1980s. This has occurred despite the fact that banks are operating in riskier markets following deregulation. In the balance of strong competitive pressures, these riskier markets would have resulted in higher rather than lower margins being earned to compensate for the greater probability of bad debts.”
“As banks become more efficient operating expenses to assets have fallen.”
The Reserve Bank, in its submission to the Inquiry, included the following table:
| % of Average Assets | ||
|---|---|---|
| 1980/85 | 1986/90 | |
| Net Interest | 3.7 | 3.3 |
| Non-Interest | 1.8 | 1.7 |
| Operating Expenses | 3.9 | 3.2 |
| Bad Debt Expense | 0.2 | 0.5 |
| Tax | 0.6 | 0.6 |
| Profit | 0.8 | 0.7 |
| Source: RBA Submission to the Inquiry into the Australian Banking Industry, January 1991, page 17 | ||
“This fall ‘(in profits)’ occurred despite a substantial increase in the efficiency of banks as indicated by the reduction in their operating costs. Part of the reduction in operating costs was absorbed by higher bad debt expenses but most of it was passed on to customers through lower interest margins and fees – suggesting the operation of substantial competitive forces.”
(e) Why Go any Further?
The figures and Reserve Bank analysis seem to answer all our questions. Costs have fallen significantly and this has allowed Australian banks to both reduce net interest income and have more bad debts without moving into loss. But relying on this downward trend in the aggregates for both costs and net interest income as a percentage of average assets as our indicator of the benefits delivered by deregulation is fraught with danger. The fact that the analysis points to banks being kinder to customers on fees now than they were 10 years ago is food for thought. Does our intuition suggest that fees are lower now than at the beginning of the decade or does the ratio of fees to assets tell us more about assets than it does about fees?
The mix of retail/corporate, onshore/offshore business is crucial to these aggregates. We will present data to show that operating costs and net interest income per $A100 of assets can be as low as 50 cents for corporate business (how else could international banks lend at 0.25 per cent over LIBOR), as high as $A5 for retail (the current ratios for Bank of Queensland are 5.7 per cent for net interest income and 4.7 per cent for operating costs) and as low as $1.50 for retail lenders with no payments system obligations (see the data on US Saving and Loan Associations (S&Ls) in Table 2).
(f) Payments System a Cost Burden on Banks
The payments system reflects pretty obviously in banks' costs, particularly in their domestic costs. However, the retrieval of those costs comes partly from fees and partly from margins and that mix of fees and margins has been changing.
When there was no way for the average person to take advantage of the fact that money had an overnight value, banks had a convenient method of paying for the payments system. Idle balances in no or low-interest transaction type accounts contributed handsomely to banks' margins. Deregulation has allowed banks to pay interest on call money and cheque accounts. Logically, banks should be compensated for cheque processing by the users and that means fee for service.
So a sensible assessment of the impact of deregulation on margins would need access to the proportion of costs which reflect payments processing as opposed to gathering deposits and making loans. Such a breakdown in costs is not available. We are able to cast some light on this important distinction between “borrowing/lending” and “payments facilitation” by presenting numbers for S & L societies in the United States which had few payments system obligations 15 years ago.
(g) Trading Rooms Do Not Generate Net Interest Income
The increasing amount of trading and guaranteeing which now goes on in a bank causes headaches for prudential supervisors but it also means for our purposes that there have been important additions to banks' costs which should not have reflected in margins.
The development of trading and other off-balance sheet profits as a source of banks' maintainable earnings has required expenditure on dealing rooms and communications which is designed to generate a profit from trading or risk protection. There are clearly more costs in the 1980s and 1990s than there were in the 1970s for which banks should not logically seek compensation through interest rate margins.
The data above from the Reserve Bank submission show that income from fees, commission and trading profits – non-interest income – has not kept pace with the growth in assets. This would be an odd result if one did not keep in mind the tremendous pace at which assets grew.
2. The Facts on Costs and Margins
(a) The Historical Perspective
Consistent series of data on Australian banks' costs, net interest income and non-interest income derived from their Australian operations from the mid 1960s to the present would be the desirable place to start. It would allow us to put the experience of the 1980s into its proper context. However, such series do not exist. It is only in the past 10 years that Australian banks have begun to publish any detail on their pre-tax profit and only in the last three years that listing in the United States has forced them to produce the sort of detail American analysts have taken for granted for decades.
Fortunately, a survey conducted by Professor J.R.S. Revell for the OECD in 1980 on Costs and Margins in Banking gives us a place to start. It includes statistics for many OECD countries for the period 1964 to 1977. Australia was included in a limited way in the original document and also in an update which covered the period 1978–82, but a further update published in 1987 covering the period 1980–1984 did not even bother to include Australia.
The trends in the ratios for these English speaking countries are instructive.
| Canada | United States | Aust. | United Kingdom |
||||||
|---|---|---|---|---|---|---|---|---|---|
| Commercial Banks |
S&L |
Savings Banks |
|||||||
| 1966 | 2.32 | 2.06 | 1.04 | 0.61 | 3.23 | * | |||
| 1969 | 2.30 | 2.30 | 1.08 | 0.66 | 3.65 | * | |||
| 1972 | 2.18 | 2.20 | 1.12 | 0.80 | 3.89 | * | |||
| 1975 | 2.40 | 2.24 | 1.28 | 0.99 | 4.20 | * | |||
| 1977 | 2.45 | 2.45 | 1.28 | 1.07 | 4.79 | * | |||
| # | |||||||||
| 1982 | 1.96 | 2.92 | 1.57 | 1.51 | 5.83 | 3.42 | |||
| 1983 | 2.03 | 2.95 | 1.70 | 1.63 | * | 3.29 | |||
| 1986 | 2.15 | 3.18 | 2.17 | 1.81 | * | 3.23 | |||
| * not included # the original Revell Data was for “Chartered Banks” and the updates were for “Canadian Banks on a global consolidated basis”. It would appear that the inclusion of the international business in the 1982 update was responsible for the discrete drop in the ratio. Apart from this break in series, the ratio for the Canadian banks is much lower than Australia and shows a more subdued upward drift over the 20-year period Source: Costs & Margins in Banking: A Survey Conducted for the OECD by J.R.S. Revell |
|||||||||
The statistics for Australia in the 1980 edition show that the ratio of operating costs to average assets for Australia's Major Trading Banks grew from around 3.2 per cent in 1966 to 4.8 per cent in 1977. For most of this period, assets grew by 3 per cent to 5 per cent more quickly than inflation. However, in 1972 and 1973, when assets grew in real terms by 8 per cent and 14 per cent respectively, the ratio of operating costs to average assets actually fell from 4.0 per cent in 1971 to 3.9 per cent in 1972 and 3.6 per cent in 1973.
The update for 1978–84 shows the ratio of operating costs to average assets growing further from 4.7 per cent in 1978 to a massive 5.8 per cent in 1982. This number for 1982 compares with 3.4 per cent for large banks in the United Kingdom, 2.9 per cent in the United States and 2.0 per cent in Canada. This could, of course, be interpreted as evidence that Australia's regulated financial system produced an increasingly inefficient banking system which by 1982 was about half as productive as banks in deregulated systems. But was the US system deregulated in a sense which logically enhanced productivity? One cannot help wondering about measurement error.
The US data reveals that for each of the three classes of banks shown there was a steady upward drift in the ratio of operating costs to average assets. Were these banks becoming increasingly inefficient? But the most important clue in this table is the variation between the different classes of banks. Those which, particularly in the early years, had little or no participation in the payments system had ratios of costs to average assets of 1 per cent and less. Remember when Australia's building societies could borrow at 6 per cent and lend at 7.5 per cent. (The GIO of Australia is at present offering housing finance at the bank bill rate plus 1.25 per cent.)
The 5.8 per cent published for Australian banks in the OECD document is well above the number of around 4.6 per cent for 1982 which has been used by Treasury, the NAB and the Reserve Bank in various publications and is the first plot on Figure 4 above. The definitional difference appears to be that the 5.8 per cent was for trading bank activities in Australia, whereas the 4.6 per cent was for group activities on a global basis. Even 4.6 per cent looks dramatically high compared to the United States, Canada and even the United Kingdom clearers, where the payments system obligations, one would expect, would be comparable to Australia's major banks.
Suffice to say for our purposes that the ratio of operating costs to average assets in Australia rose dramatically over the period from 1964 to 1982, except in years when asset growth exceeded the rate of inflation by an explosive margin.
This suggests an immediate clue for the 1980s. An important impact on a falling ratio of costs and net interest income to assets would naturally come from the escalation of asset growth to a healthy margin over the rate of wage inflation, and from the rate of growth in the burden imposed by payments systems obligations. The assets of Australian banks certainly grew at a healthy rate in the 1980s and wage inflation was contained to a great extent by the Wages Accord. Measuring what happened to the payments system does not seem to be possible.
Of course, asset growth which comes from acquisitions will have a different impact on cost ratios than organic asset growth. Australia and New Zealand Banking Group (ANZ) and NAB have each made major offshore acquisitions in the 1980s.
The Commonwealth Bank of Australia (CBA) made an acquisition in New Zealand late in the decade, but essentially its activities were home grown. So let's look at the CBA's data for costs and net interest income to average assets, and at its asset growth, over the 1980s.
| Operating Costs to Average Assets* % |
Asset Growth % |
Net Interest Income to Average Assets % |
|
|---|---|---|---|
| 1982 | 4.16 | 14 | 4.02 |
| 1983 | 3.95 | 14 | 3.65 |
| 1984 | 3.93 | 16 | 3.69 |
| 1985 | 3.68 | 15 | 3.62 |
| 1986 | 3.68 | 13 | 3.83 |
| 1987 | 3.67 | 11 | 3.56 |
| 1988 | 3.54 | 15 | 4.00 |
| 1989 | 3.27 | 20 | 3.87 |
| 1990 | 3.28 | 11 | 3.73 |
| * Excludes provisions for bad debts Source: Commonwealth Bank Annual Report 1990 |
|||
The cost ratio has certainly come down, which could be taken as evidence of increasing efficiency. I am sure that the CBA would argue that they worked very hard over the decade to achieve these efficiencies. Closer inspection shows that the cost ratio took its biggest dives in 1989 when assets grew by 20 per cent and 1985 when assets grew by 15 per cent. The decline lost momentum in 1990 when assets grew by only 11 per cent and in 1986 and 1987 when asset growth was 13 per cent and 11 per cent respectively. In 1990 costs were helped by the absence of a need to contribute to the staff superannuation fund.
(b) A Possible Relationship between Asset Growth and Cost Growth
So we get the distinct impression that the engine we are witnessing is one which relies on assets growing by 5 percentage points more than the rate of inflation to get our cost ratio falling. One could hypothesise (Table 4) that a bank with a ratio of costs to assets of 4 per cent would keep a steady ratio as long as its assets grew by inflation (say, 8 per cent) plus say the rate of growth in the population (2 per cent) plus the growth in community's propensity to demand banking services (say, 2 per cent). Asset growth in excess of this hypothetical 12 per cent would only add to costs at the rate of 1 cent for every $1 of assets. The 1 cent per $1 reflects our earlier evidence that the pure function of borrowing and lending can be done at such margins.
| Assets | Costs | Ratio | ||
|---|---|---|---|---|
| Start | $100.00 | $4.00 | 4.00% | |
| Grow | 12% | $112.00 | $4.48 | 4.00% |
| 15% | $115.00 | $4.51 | 3.92% | |
| 20% | $120.00 | $4.56 | 3.80% | |
| 1986 | 1987 | 1988 | 1989 | 1990 | |
|---|---|---|---|---|---|
| Westpac: | |||||
| Australia | n.a. | 3.2 | 3.9 | 2.6 | 2.9 |
| Overseas | n.a. | 1.5 | 2.0 | 1.6 | 1.4 |
| ANZ: | |||||
| Australia | n.a. | n.a. | 3.3 | 2.4 | 2.3 |
| Overseas | n.a. | n.a. | 1.0 | 1.5 | 1.1 |
| NAB: | |||||
| Australia | 1.9 | 2.3 | 4.2 | 4.1 | 3.0 |
| Overseas | 1.3 | 0.6 | 1.4 | 0.7 | 2.7 |
| Spreads are the gap between average rates paid and average rates earned Source: Each bank's Annual Report, various years |
|||||
| 1980 | 1982 | 1984 | 1989 | 1990 | |
|---|---|---|---|---|---|
| Domestic | 2.43 | 2.39 | 2.96 | 3.40 | 3.45 |
| International | 0.58 | 0.49 | 0.67 | 2.27 | 2.25 |
| Source: Bank of Montreal Annual Reports | |||||
More output from the same input is only an improvement in efficiency if the extra output is useful. It is a matter for conjecture whether this extra 5 per cent to 6 per cent of asset growth per annum which has allowed cost ratios to fall in the 1980s was particularly useful.
(c) Net Interest Income and the Volume of International Business
The CBA numbers contain another important piece of evidence. Notice how the downward trend in the ratio of net interest income to average assets is nowhere near as obvious as in the figure for the four major banks presented earlier (Figure 3). The CBA's ratio of net interest income to average assets looks pretty much the same in 1988, 1989 and 1990 as it did in 1982, 1983 and 1984. If we adjust assets for bill acceptances which do not generate any net interest income, we find that the ratio adjusts to 4.4 per cent in 1982 and 4.3 per cent in 1990. Not much benefit to the borrowers and lenders for eight years of “improved efficiency coming from deregulation”.
Cost savings in the CBA's case seem to have gone to bringing its return on shareholders' funds up to that of its competitors; they have contributed little to reducing the CBA's ratio of net interest income to average assets. Obviously, the CBA could not be operating at substantially different margins in Australia to its major competitors. The fact that its ratio of net interest income to average assets has not fallen must make us wonder whether the drop in this ratio for the other banks is telling us what we want to know.
We will now try to explain why the CBA's ratio of net interest income to average assets does not fall in line with the trend presented in Figure 3 for the major banks as a group. The nature of the CBA's business has changed least over the decade. Its only real excursion internationally has been its acquisition in New Zealand. The corollary is that if we could compare apples with apples there would be very little evidence of finer interest rate margins in the Australian business of the other major banks.
We start with a table which proves conclusively that the sort of overseas business conducted by Westpac, ANZ and NAB until they acquired Yorkshire Bank was done at average spreads which were extremely skinny relative to Australia.
Westpac had, in each year 1987 to 1990, close to 40 per cent of its interest-bearing assets offshore. The margins are on average 1.5 per cent lower than in Australia. Statistics are not available but commonsense dictates that if interest spreads in the offshore business are around 1.5 per cent less than in Australia then costs per dollar of assets must be something less. The lack of payments system obligations in the overseas operations would be one reason for lower costs per $100 of assets, the larger average size of transactions would be another.
The following table from the 1984 and 1990 Annual Reports of the Bank of Montreal is instructive:
Exceptionally low ratios of costs to average assets in international business were possible in the early 1980s and the ratio of costs to assets in international business is still two-thirds the domestic ratio. The US operations of Westpac, for example, consist of a balance sheet of around $A8 billion with a staff of 500. If total operating costs per employee were, say, $A200,000, operating costs would be $A100 million which is 1.25 per cent of average assets.
As recently as 1984, Westpac had only 22 per cent of its business offshore. A reasonable estimate of 1982 would have been 15 per cent (data not published in 1982).
If operating costs per average asset were 5 per cent in Australia (the trading bank data provided to Revell suggested 5.8 per cent) and 1.5 per cent on the business overseas (i.e. something like the interest rate spread achieved by Australian banks), and the split of business was 85 per cent in Australia and 15 per cent offshore in 1982, the average would have been 4.5 per cent. (Remember the starting point of Figure 4 is 4.6 per cent and the ratio for Westpac in the table below in 1983 was 4.4 per cent.) If in 1990 the overseas component is 40 per cent and there had been no change in the costs per average asset of 5 per cent onshore and 1.5 per cent offshore, then the overall average would have fallen from 4.5 per cent to 3.6 per cent. As we can see in the table below, by 1990 the ratio had fallen to 2.8 per cent. So the onshore/offshore mix might explain half the Westpac cost improvement.
This is not in essence a different point to the average cost/marginal cost hypothesis presented earlier. The overseas business is borrowing and lending and would contain a much below average element of payments facilitation.
Table 7 below is extracted from Westpac's submission to the Committee of Inquiry into the Australian Banking System January 1991. Costs and net interest income as a proportion of average assets have continued to fall but, again, the year of the biggest drop, 1989, was a year in which average assets grew by an amazing 25 per cent.
| Costs to Average Assets |
% Growth in Assets |
Interest Margin to Average Assets |
|
|---|---|---|---|
| 1983 | 4.37 | 3.64 | |
| 1984 | 4.34 | 13 | 3.90 |
| 1985 | 4.03 | 22 | 3.80 |
| 1986 | 3.54 | 20 | 3.60 |
| 1987 | 3.25 | 17 | 3.40 |
| 1988 | 3.14 | 17 | 3.31 |
| 1989 | 2.80 | 25 | 2.89 |
| 1990 | 2.75 | 11 | 2.84 |
| Source: Westpac Submission to the Inquiry into the Australian Banking Industry | |||
The ratio of net interest income to average assets is down by 0.80 per cent of assets, while the cost ratio is down 1.62 per cent. Our calculations above suggest that change in mix of business onshore/offshore could explain a 0.9 percentage point reduction in the ratio to average assets of costs and net interest income. So, all the drop in the ratio of net interest income to average assets could be explained by business mix and the 0.82 per cent of lower costs to assets which has not reflected in lower net interest income could well be the productivity gains. Most of this showed up as higher bad debts (0.75 per cent), with non-interest income to average assets (down from 2.28 per cent of assets in 1983 to 1.81 per cent in 1990) down by about the same amount as pre-tax profits.
(d) Some North American Comparisons
Looking at individual Australian banks over time is one way of getting around this lack of information on costs and margins in different components of the business. It is also instructive to look at similar banks from different parts of the world where the speed and extent of deregulation was different to Australia.
The two individual North American banks were selected because they currently have about as many assets as the major Australian banks (i.e. around $A100 billion) and had about the same number of staff in the mid 1980s, i.e. around 30,000. In both cases, the selected measure of efficiency, costs to average assets, shows an upward trend. Interestingly though, it finished the decade at around 3 per cent of average assets, very close to where the Australian banks finished the decade even though they started from a very different position.
Bank of Montreal began the decade with assets of C$56 billion and Manufacturers Hanover with US$59 billion. NAB and the CBA had each in 1982 only around $A20 billion in assets.
| Bank of Montreal |
Manufacturers Hanover |
Average Top 30 US Banks |
|
|---|---|---|---|
| 1981 | 1.79 | 1.87 | n.a. |
| 1982 | 1.85 | 2.14 | n.a. |
| 1983 | 1.96 | 2.26 | 2.66 |
| 1984 | 2.07 | 2.47 | 2.86 |
| 1985 | 2.25 | 2.57 | 3.10 |
| 1986 | 2.23 | 2.88 | 3.31 |
| 1987 | 2.43 | 3.17 | 3.53 |
| 1988 | 2.90 | 3.03 | 3.63 |
| 1989 | 2.95 | 3.35 | 3.58 |
| 1990 | 2.97 | 3.33 | 3.52 |
| Source: Annual Reports and Sanford C. Bernstein Research | |||
By 1990, CBA had grown to $A67 billion and NAB to $A95 billion while Manufacturers Hanover still had US$60 billion in assets (its cost still grew by 5/10 per cent per year even though its assets stood still) and Bank of Montreal had only grown to C$83 billion.
The convergence of the Australian banks and these two North American banks on an expenses ratio of 3 per cent of average assets coincides with a convergence in their asset sizes. This strongly suggests economies of scale but then what is “big-ticket” corporate business if it is not economies of scale and internationalisation. The Australian banks ratio of operating costs to average assets has fallen from 4 per cent to 3 per cent as they have geared their fixed assets (staff, equipment, premises) up to an optimum size, while the North American banks have spent most of the decade experiencing little asset growth in nominal terms and contraction in real terms as they adjusted to the problems caused by an early entry to the excesses of international lending.
Manufacturers Hanover was, in 1981, nothing if not a wholesale bank. 60 per cent of its funds were gathered in foreign offices and only one-sixth of the 40 per cent raised in the United States was in the form of retail time deposits. Its average interest rate spread in the United States was 1.06 per cent and in its foreign offices 1.11 per cent. Its overall ratio of net interest income to average assets was just 1.88 per cent. Doing this bulk of borrowing/lending business, it could run a balance sheet three times the size of the CBA in Australia with a similar number of staff.
By 1989, Manufacturers Hanover was raising 35 per cent of its funds offshore (a similar percentage to the Australian banks) and a third of the 65 per cent it raised domestically came from the retail sector. The interest rate spread had grown to 2.0 per cent in 1988, the ratio of net interest income to average assets to 2.85 per cent, and the ratio of operating costs to average assets to 3.0 per cent. The net interest margin suffered badly in 1989 due to non-receipt of LDC interest. Also, in 1989 assets fell by 10 per cent and the ratio of operating expenses to average assets rose by 11 per cent to 3.35 per cent. But as a generalisation, as its mix and size of business approached that of the major Australian banks so did its ratios of costs and margins to assets.
(e) Australian Building Societies and Small Banks
The convergence of the ratios of operating costs and net interest income to average assets of Australian and North American banks to around 3 per cent becomes even more intriguing when we look at Australian building societies in the 1980s. They have been trending up from 2.5 per cent to 3 per cent while the banks have been coming down from 4 per cent to 3 per cent.
We have also included in this table, data for the Bank of Queensland which superficially one would think was similar in the nature of its business to a building society. Its ratios are dramatically different; Bank of Queensland has long been a bank participating fully in the Australian payments system.
To finish off this section on the importance of mix of business for ratios of operating costs and net interest income to average assets, we present some key numbers on the UK domestic banks bought in recent years by National Australia Bank – Yorkshire Bank and the Clydesdale Bank in the United Kingdom. These banks produced ratios of net interest income to average assets of 5.1 per cent and 4.1 per cent respectively in 1990 and ratios of operating costs to average assets of 3.3 per cent and 4.0 per cent respectively, i.e. the two UK regional banks produced ratios similar to Bank of Queensland (Yorkshire Bank, of course, being one of the most profitable banks in the world). How have these banks survived with such ratios in the competitive UK banking environment if these ratios really are good indicators of relative efficiency?
| RESI/Statewide Bank of Melbourne | Bank of Queensland |
All Building Societies |
||||||
|---|---|---|---|---|---|---|---|---|
| Operating Costs to Average Assets | Net Interest Income to Average Assets | Operating Costs to Average Assets | Net Interest Income to Average Assets | Operating Costs to Average Assets | Net Interest Income to Average Assets | |||
| 1980 | 2.27 | 2.54 | n.a. | n.a. | ||||
| 1981 | 2.43 | 2.58 | n.a. | n.a. | 2.31 | 2.75 | ||
| 1982 | 2.59 | 2.62 | n.a. | n.a. | 2.64 | 3.17 | ||
| 1983 | 3.01 | 3.10 | n.a. | n.a. | 2.81 | 3.20 | ||
| 1984 | 2.87 | 3.15 | n.a. | n.a. | 2.87 | 3.28 | ||
| 1985 | 2.56 | 2.75 | n.a. | n.a. | 2.95 | 3.16 | ||
| 1986 | 2.06 | 1.60 | 5.57 | 6.92 | 2.71 | 2.70 | ||
| 1987 | 3.00 | 2.74 | 5.92 | 5.38 | 3.03 | 2.96 | ||
| 1988 | 3.04 | 3.52 | 5.87 | 5.83 | ||||
| 1989 | 2.75 | 3.21 | 5.20 | 5.73 | ||||
| 1990 | 2.71 | 3.11 | 4.81 | 5.73 | ||||
(f) Business Mix Dominates Information about Efficiency
Movements in the ratios of net interest income and operating expenses to average assets for the major Australian banks are likely to give us false signals about efficiency and the real margin between domestic lending and deposit rates unless we can look separately at the costs and revenue in:
-
network dependent business;
- payments system related business;
- borrowing and lending in retail quantities.
-
communications dependent business:
- borrowing and lending in capital markets quantities;
- trading in financial markets.
(g) Interest Spreads
Comparing the rate on a particular loan with the rate on a particular type of deposit has many drawbacks, but as we have illustrated above the drawbacks of broader measures are fairly daunting.
The intermediate step of looking at the average rate earned on the portfolio compared with the average costs of the deposits which support that portfolio will suffer from the problems changing mix of business but it was a technique used by the Reserve Bank in its submission to the Martin Inquiry so let us have a look.
Paragraph 51 “If we put aside offshore business … and look only at … average interest rates on domestic deposits … and on domestic loans … interest spread declined from 5.0 per cent to 4.6 per cent.”
To make this calculation, the Reserve Bank had to call on unpublished information provided by the banks. It is a similar concept to the information published in our Table 5. However, that information on spreads has only been published in recent years and the spreads published by the banks do not include interest-free deposits in their calculation; they are for interest-bearing liabilities and assets only. The published spreads for Australia show no downward trend apart from ANZ's numbers which are dominated by non-performing loans.
(h) Costs to Income
The foregoing illustrates that the relationship between the level of a bank's costs/revenues and its assets will vary widely according to the type of bank that it is. Thus, any assessment of trends over time in the relationship between its costs/revenues and its assets will need to carefully weigh changes that have occurred in the nature of its business.
Bankers sometimes respond that the true measure of efficiency is costs to income. Income is the amount the community is willing to pay for the services provided by banks, i.e. a true value of their output. Costs are the true measure of their input and one to the other gives efficiency. Australian banks like to boast that this ratio has fallen.
The corollary of this falling ratio of costs to revenue is that (revenue minus costs) divided by costs (i.e. the profit margin) must have risen. The trick is that costs excluded bad debts so the existence of a growing share of bad debts allows banks to say that they are simultaneously more efficient but that their return on shareholders' funds is falling. The benefits of deregulation were enjoyed by those allowed to borrow money without ever having to pay it back.
The ratio of costs to revenue is a suitable means of comparing a bank with its peers and judging that individual bank's relative efficiency. However, it does not seem suitable to use as a measure of the system's efficiency. We need a comparison of costs to the volume of useful service provided by the financial system to the community.
(i) Profitability
Table 1 showed us that on average in the period 1986 to 1990 the major Australian banks made profits equal to 0.7 per cent of average assets compared to 0.8 per cent in the period 1980 to 1985. The same submission provides the following information on Page 17.
| Major Banks | All Banks | All Companies | |
|---|---|---|---|
| 1982/85 | 16 | 15 | 9 |
| 1986/90 | 13 | 11 | 10 |
There seems little doubt that increased competition has reduced the profitability of Australian banks, but I would intrude two important qualifications:
- the upward spiral in bad debts observed in Table 1 made it impossible for banks to improve profitability, i.e. to attribute the lower profitability to increased competition is one explanation, but to attribute it to poor credit assessment seems equally plausible. In 1989 the Australian banks returned profit results which were well up with those of the early 1980s;
- changes to the Australian tax system which introduced imputation of tax credits for share dividends from 1987 should have meant that bank shareholders were willing to accept a lower after-tax return on shareholders' funds since dividends can be effectively tax free, i.e. competition should have ensured that some of the benefits of imputation were shared by shareholders with customers of the banks. It should have reflected in banks setting lower hurdle rates for return on capital.
3. Overall Findings
It is probably true that deregulation has produced some shaving of banking profitability in Australia and some reduction in the average margin between rates paid and charged by banks, but the measures of costs and margins to average assets commonly used to illustrate this point grossly overstate the reduction. Productivity improvement in all Australian industries has been slow and so genuine reduction in margins over a ten-year period would only be expected to be slight.
The fact that the lower margins are not apparent in the numbers for the building societies which did not have interest-free deposits to start with (see Table 9) indicates strongly that it is payment of interest on cheque accounts which is the main force for the smaller spread found by the Reserve Bank in its confidential survey of banks.
The use of ratios of operating costs and net interest income to average assets as measures of efficiency and margins is useful for comparing one six months with another, but as a tool for looking at trends over a decade it is dangerous. The ratios are dominated by the explosive growth in the denominator in the period under review and the changing mix of business. The ratios do not separate payments system costs which grow with the size of the community and the increased willingness of the community to use banking facilities from the costs of intermediation. It is the latter costs which should be relevant to interest rate margins.
At the start of the decade, Australian banks relative to North American banks were undergeared in terms of the ratio of assets to staff, premises and equipment. No major bank tried to compete by reducing costs or by specialising in low-risk activities (there was even some debate about whether a foreign bank which did specialise in minimising credit risk rather than running up its balance sheet was actually doing “banking business”); all major banks and state banks chased extra business to make their existing infrastructure pay its way.
With the current strategies of each major bank to consolidate, cut costs, make every piece of business pay its way in terms of return on capital, perhaps we are only now seeing the most productive response to the freedom to compete. Banks now want to be the best not the biggest.
One cannot help but feel, however, that to date the only unambiguous beneficiaries were those who sold the assets to the borrowers who paid with money that was never to be repaid.